Zendesk Explore metrics: A complete guide to tracking support performance
Stevia Putri
Last edited March 4, 2026
If you're managing a support team, you already know that gut feelings don't cut it when it comes to making decisions. You need data. That's where Zendesk Explore comes in. It's the analytics and reporting tool built into Zendesk that helps you turn ticket data into actionable insights.
But here's the challenge: Explore is powerful, yet many teams barely scratch the surface of what it can do. They stick to the default dashboards and miss opportunities to build custom metrics that answer their specific business questions.
This guide will show you how to get more out of Zendesk Explore. You'll learn the difference between metrics and attributes, discover the essential built-in metrics every team should track, and get eight ready-to-use custom metric formulas you can implement today. We'll also touch on how AI teammates like eesel AI can act on the insights these metrics reveal, turning data into automated action.

Understanding Zendesk Explore metrics and attributes
Before you start building reports, you need to understand the building blocks. In Zendesk Explore, everything comes down to two concepts: metrics and attributes.
Metrics are quantifiable values. Think numbers you can count, sum, or average: ticket volume, reply counts, resolution times, satisfaction scores. When you want to know "how many?" or "how long?", you're asking for a metric.
Attributes are non-quantifiable values that describe or categorize your data: ticket status, assignee name, channel, tags, priority. When you want to know "which?" or "what type?", you're working with attributes.
Here's how they work together. Let's say you want to know how many tickets each agent solved last week. "Tickets solved" is your metric. "Agent name" and "Date" are your attributes. You use the attributes to slice the metric into meaningful segments.

Explore organizes data into datasets based on Zendesk products:
- Tickets dataset General ticket information like creation date, status, and satisfaction ratings
- Updates history dataset Changes made to tickets over time, including field updates and comment history
- Backlog history dataset Historical snapshots of your ticket backlog
- SLAs dataset Service level agreement performance data
When you create a report, you choose the dataset that contains the data you need. Most support teams spend most of their time in the Tickets dataset.
Metrics also use aggregators that determine how values are calculated. The most common are:
- COUNT Counts the number of values
- SUM Adds up all values
- AVG Calculates the average
- D_COUNT Counts unique values only
Explore automatically applies a default aggregator to each metric, but you can change it based on what you're trying to measure.
Essential built-in metrics every team should track
Zendesk Explore comes with dozens of pre-built metrics. While you might eventually create custom ones, these built-in metrics form the foundation of any good support analytics program.
Ticket volume metrics
These tell you how much work is coming in and going out:
- Tickets Total tickets created. This is your baseline for understanding workload.
- Solved tickets Tickets that have been resolved. Compare this to "Tickets" to see if you're keeping up.
- Unsolved tickets Open, pending, and on-hold tickets. This is your current backlog.
- Reopened tickets Tickets that were solved but then reopened. High numbers here suggest quality issues.
Performance metrics
These measure how quickly and efficiently your team works:
- First reply time How long customers wait before getting an initial response. This heavily impacts customer satisfaction.
- Full resolution time Total time from ticket creation to final resolution. The complete picture of customer wait time.
- Agent replies Number of public replies an agent sends. Helps identify efficiency patterns.
- One-touch tickets Tickets solved with just one agent reply. Higher percentages mean more efficient resolution.
Quality metrics
These reveal how well you're actually solving problems:
- Customer satisfaction score Percentage of positive ratings. The ultimate measure of support quality.
- Reopen rate Percentage of solved tickets that get reopened. Indicates first-contact resolution quality.
- Escalation rate How often tickets get passed between agents or teams.
Workload metrics
These help you balance work across your team:
- Unassigned unsolved tickets Tickets sitting in the queue waiting for an owner.
- Pending tickets Tickets waiting for customer response. High numbers might indicate follow-up issues.
- Tickets per agent Workload distribution across your team.
The key is tracking these over time, not just looking at snapshots. A single week's data tells you little. Three months of trends tell you where to focus your improvement efforts.
Creating custom calculated metrics in Explore
Built-in metrics get you started, but every business has unique reporting needs. That's where standard calculated metrics come in. These let you create custom formulas that answer your specific questions.
When to use custom metrics
Consider creating a custom metric when:
- You need to filter data in ways the built-in metrics don't support
- You want to combine multiple conditions (e.g., "VIP customers who waited more than 24 hours")
- You need to calculate ratios or percentages not available by default
- You want to track business-specific categories (e.g., tickets about a specific product line)
The formula structure
Most calculated metrics use a simple IF/THEN/ENDIF pattern:
IF ([condition]) THEN [value] ENDIF
This says: if the condition is true, include this value in the metric. If not, exclude it.
For multiple conditions, you use AND and OR:
IF ([condition 1] AND [condition 2]) THEN [value] ENDIF
Both conditions must be true for the value to be included.
How to create a standard calculated metric
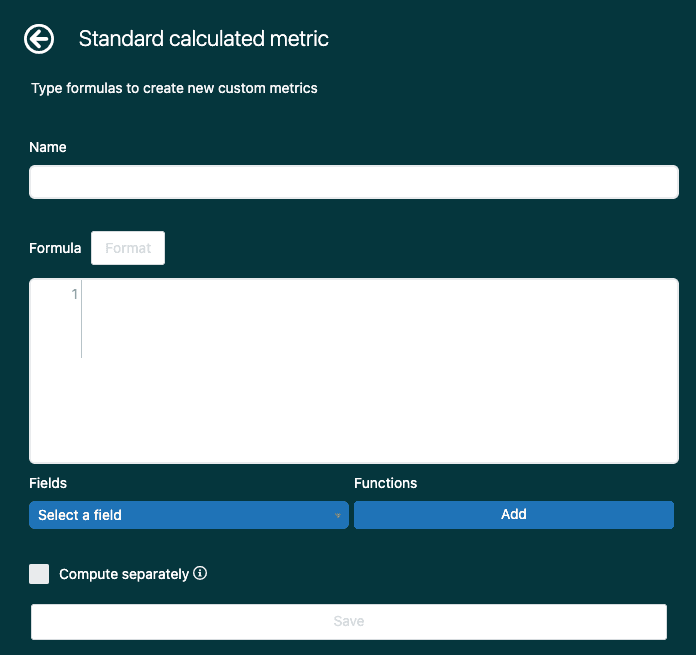
- In Explore, open a new or existing report
- Click the Calculations menu (calculator icon) in the right sidebar
- Select Standard calculated metric
- Give your metric a clear, descriptive name (avoid special characters)
- Enter your formula in the Formula field
- Click Save
Your new metric appears in the Calculated metrics folder when you add metrics to your report.
Tips for validating formulas
- Start with a simple formula and test it before adding complexity
- Use the "Select a field" button to ensure you're using correct field names
- Look for the green checkmark that indicates valid syntax
- Compare results against known data to verify accuracy
- Document what each metric does so your team understands it
8 ready-to-use custom metric formulas
Here are practical formulas you can implement immediately. Each solves a common reporting need.
1. Email-only tickets
Count tickets submitted through email only:
IF ([Ticket channel]="Email") THEN [Ticket ID] ENDIF
Useful for: Understanding channel preference and staffing email-specific workflows.
2. Tickets solved in under 20 minutes
Track quick resolutions that indicate efficient handling:
IF ([Ticket status - Unsorted] = "Solved" AND [Business hours until solve] < 20) THEN [Ticket ID] ENDIF
Useful for: Identifying easy wins and setting team efficiency targets.
3. VIP customer tickets
Isolate tickets from your most important customers:
IF ([Organization name] = "VIP") THEN [Ticket ID] ENDIF
Replace "VIP" with your actual VIP organization name. Useful for: Prioritization and executive reporting.
4. Tickets with no agent reply
Find tickets where customers are still waiting:
IF (VALUE(Agent replies) < 1) THEN [Ticket ID] ENDIF
Useful for: Identifying tickets that have slipped through the cracks.
5. Weekend tickets
Track tickets created outside business hours:
IF (WEEKDAY([Ticket created - Date]) = 6 OR WEEKDAY([Ticket created - Date]) = 7) THEN [Ticket ID] ENDIF
Useful for: Understanding after-hours workload and planning coverage.
6. Escalated tickets
Count tickets that moved between multiple groups:
IF (VALUE(Group stations) > 1) THEN [Ticket ID] ENDIF
Useful for: Identifying complexity patterns and training needs.
7. First contact resolution
Track tickets solved without back-and-forth:
IF (VALUE(Agent replies) < 2 AND ([Ticket status - Unsorted] = "Solved" OR [Ticket status - Unsorted] = "Closed")) THEN [Ticket ID] ENDIF
Useful for: Measuring efficiency and customer effort reduction.
8. Tickets by specific tag
Count tickets with a particular tag:
IF (IN([Ticket tags], "urgent")) THEN [Ticket ID] ENDIF
Replace "urgent" with any tag you use. Useful for: Tracking specific issue types or product areas.
Building your first report with custom metrics
Creating metrics is only half the battle. You need to present them in reports that drive decisions.

Selecting the right dataset
Start by choosing the dataset that contains the data you need:
- Use the Tickets dataset for general ticket metrics
- Use Updates history when you need to track changes over time
- Use SLAs dataset for agreement performance tracking
Adding metrics and attributes
- Click Add in the Metrics panel and select your metric
- Click Add in the Columns or Rows panel to add attributes
- Choose how to visualize the data (table, chart, etc.)
Using filters effectively
Filters help you focus on specific time periods or segments:
- Add date filters to look at specific weeks or months
- Use attribute filters to isolate specific channels, groups, or priorities
- Combine multiple filters to answer precise questions
Saving and sharing
Once you've built a useful report:
- Click Save and give it a descriptive name
- Add it to a dashboard for easy access
- Set up scheduled emails to share with stakeholders
- Export data when you need to analyze it elsewhere
Best practices for organizing and documenting metrics
As you create more custom metrics, organization becomes critical. Without it, you'll end up with a mess of unclearly named metrics that confuse your team.
Naming conventions
Use consistent, descriptive names:
- ✅ "VIP tickets - last 30 days"
- ✅ "Email channel - solved under 1 hour"
- ❌ "Custom metric 1"
- ❌ "Test metric"
Include the time period or key condition in the name so the purpose is clear at a glance.
Documentation
Create a simple spreadsheet that tracks:
- Metric name
- What it measures
- The formula used
- When to use it
- Who created it
This prevents duplication and helps onboard new team members.
Testing and validation
Always test new metrics against known data before sharing:
- Pick a small date range where you know the expected result
- Compare the metric output to manual counts
- Verify that filters are working as intended
Archiving outdated metrics
When metrics are no longer needed:
- Rename them with "[ARCHIVED]" prefix
- Document why they were archived
- Delete only after confirming no reports depend on them
While you're organizing your metrics, consider how eesel AI can complement your reporting. Instead of just viewing metrics, our AI teammate can monitor them continuously and take action automatically, like escalating VIP tickets or routing based on complexity.

Taking action on your Zendesk Explore metrics
Metrics are only valuable if they drive action. Here's how to turn your Explore data into real improvements.
Setting up alerts and scheduled reports
Don't wait for stakeholders to ask for data:
- Schedule weekly or monthly reports to send automatically
- Set up dashboards that refresh in real-time
- Create alerts for thresholds (e.g., when backlog exceeds a certain number)
Informing staffing decisions
Use metrics to justify headcount changes:
- Ticket volume trends show when you need more agents
- First reply time spikes indicate coverage gaps
- Resolution time patterns reveal training needs
Identifying training opportunities
Metrics highlight where agents struggle:
- High reopen rates suggest quality issues
- Low one-touch resolution rates indicate knowledge gaps
- Escalation patterns show where agents need more authority or training
Automating actions with AI
Here's where modern AI tools change the game. While Explore shows you what's happening, AI agents can actually do something about it.
For example, eesel AI integrates directly with Zendesk and can:
- Monitor ticket queues and auto-assign based on agent capacity
- Escalate VIP tickets immediately when they arrive
- Route complex issues to senior agents automatically
- Tag and categorize tickets without manual effort
Instead of just knowing you have 50 pending tickets, an AI teammate can ensure they're distributed optimally and that urgent issues get immediate attention. The metrics show you the problem. The AI solves it.
If you're looking to move beyond reporting into action, explore how eesel AI works alongside your Zendesk setup to automate the routine work while your team focuses on complex customer issues.