Zendesk reporting basics: A complete guide for support managers
Stevia Putri
Last edited March 3, 2026
If you're a support manager, you've probably stared at a wall of ticket data wondering what it actually means for your team. Zendesk Explore exists to answer that question. It's the analytics platform built into Zendesk that transforms raw ticket information into reports and dashboards you can act on.
This guide covers the Zendesk reporting basics you need to start making sense of your data. We'll walk through the core concepts, show you how to build your first report, and explain the metrics that actually matter for running a support operation.
What is Zendesk Explore?
Zendesk Explore is the dedicated analytics tool within the Zendesk ecosystem. It connects to your Support, Talk, Chat, and Guide data to help you understand what's happening across your customer service operation.
Here's the simple version: Explore takes all the activity in your Zendesk account (tickets created, solved, updated, and everything in between) and lets you ask questions about it. How many tickets did we solve last week? Which agents have the fastest first reply times? Are customers happier with chat compared to email?
Without a tool like Explore, you're left exporting spreadsheets and trying to make sense of raw data manually. With it, you can build reports that update automatically and dashboards that give you a real-time view of your operation.
For teams that want to go beyond historical reporting and get proactive insights, eesel AI can work alongside your help desk to surface real-time patterns and identify knowledge gaps. But before you get there, you need to master the Zendesk reporting basics.
Understanding the building blocks: Datasets, metrics, and attributes
Before you build anything in Explore, you need to understand three concepts that form the foundation of every Zendesk reporting basics workflow. Think of them as the what, how much, and who of your data.
Datasets: Your data libraries
A dataset is a pre-sorted collection of information about a specific area of your Zendesk account. Zendesk organizes your data into datasets so you can focus on the relevant information for your question.
The most common datasets you'll use:
- Support: Tickets Everything related to ticket creation, solving, and status. Use this for 80% of your reports.
- Support: Updates History Every change made to tickets. Useful for understanding agent activity and collaboration.
- Talk Voice call data including wait times, talk time, and agent availability.
- Chat Live chat conversations, agent engagement, and chat satisfaction.
- Guide Help center article views, searches, and community activity.
Choosing the right dataset is the most important first step in Zendesk reporting basics. If you want to know how many tickets each agent solved, you need the Tickets dataset. If you want to see how many updates agents made to tickets (including internal notes and reassignments), you need the Updates History dataset.
Metrics: The numbers you measure
Metrics are the quantifiable data points in your reports. They're almost always numbers. Every report must contain at least one metric.
Common metrics include:
- Tickets The count of tickets (created, solved, open, etc.)
- First Reply Time How long before an agent first responds
- Full Resolution Time Total time from creation to solved
- CSAT Customer satisfaction scores
- Agent Touches Number of updates agents make to tickets
Metrics answer "how much" or "how many." Without a metric, your report won't have numbers to show.
Attributes: How you slice the data
Attributes are the qualitative details that give context to your metrics. They let you break down your numbers by categories like who, what, when, and how.
Common attributes you'll use in Zendesk reporting basics include:
- Assignee name Which agent handled the ticket
- Ticket status New, open, pending, solved, closed
- Channel Email, chat, web form, API, etc.
- Ticket created date When tickets were opened
- Group Which team or department owns the ticket
Here's how metrics and attributes work together in Zendesk reporting basics. If your metric is "Solved tickets" and your attribute is "Assignee name," Explore shows you how many tickets each agent solved. Change the attribute to "Channel" and you'll see how many tickets were solved by email versus chat versus phone.
Getting started with prebuilt dashboards
Before you build custom reports, start with what Zendesk gives you out of the box. Prebuilt dashboards exist for each Zendesk product and provide immediate insights without any configuration.
When you first open Explore, you'll find dashboards for:
- Support Ticket volume, agent performance, satisfaction scores
- Talk Call volume, wait times, agent availability
- Chat Chat volume, agent engagement, chat satisfaction
- Guide Article views, search terms, community activity
These dashboards contain two types of reports:
Sample reports are marked with a [sample] label in their titles. They showcase what is possible and serve as starting points you can clone and customize.
Default dashboard reports are created automatically by Zendesk and update with your live data. They give you a baseline view of your operation.
Prebuilt dashboards are sufficient when you need standard KPIs and don't have complex reporting requirements. They answer questions like "how many tickets did we get this week" and "what's our average CSAT."
You'll need custom reports when you have specific questions the prebuilt dashboards don't answer. Things like "how many tickets did Agent X solve that were tagged 'billing' and created on weekends" require building your own report.
Creating your first custom report
The best way to learn Explore is to build something useful. Let's walk through creating a report that tracks solved tickets by agent over the last 30 days. This is a common report support managers need for performance tracking.

Step 1: Navigate to the Reports library and click New report
From the Explore interface, click the Reports icon in the left sidebar. Then click the "New report" button to start building.
Step 2: Select the Support: Tickets dataset
Explore prompts you to choose a dataset. Since we're tracking solved tickets, select "Support: Tickets." This dataset contains all the ticket-related metrics and attributes we need.
Step 3: Add the Solved tickets metric
In the Metrics panel on the right, click "Add." Search for "Solved tickets" and select it. Click "Apply." You'll see a single number appear: the total count of solved tickets in your account.
Step 4: Add Assignee name to Columns
Now we want to see who solved those tickets. In the Columns panel, click "Add." Search for "Assignee name" and select it. Click "Apply." The single number breaks down into a list showing each agent and their solved ticket count.
Step 5: Add a Time filter for Last 30 days
We only want recent data. In the Filters panel, click "Add." Search for "Time - Ticket solved" and select it. Choose the date range "Last 30 days" and apply. Now your report shows only tickets solved in the past month.
Step 6: Save and name your report
Click the save icon and give your report a clear name like "Solved tickets by agent - Last 30 days." Choose whether to add it to an existing dashboard or keep it standalone.
The order matters here. You start with the dataset (what data to look at), add a metric (what to count), then add attributes (how to break it down), and finally filters (which records to include). This logical flow helps you build reports that answer specific questions in your Zendesk reporting basics workflow.
Essential metrics every support manager should track
Not all metrics are equally useful. Here are the ones that actually inform decisions about staffing, training, and process improvement.
| Metric | What It Tells You | Decision It Informs |
|---|---|---|
| Ticket Volume | Total tickets created, solved, and open | Staffing levels and capacity planning |
| First Reply Time | Average time to first agent response | SLA targets and responsiveness standards |
| Full Resolution Time | Average time from creation to solved | Process efficiency and complexity assessment |
| CSAT | Percentage of customers rating support positively | Quality initiatives and training priorities |
| Agent Touches | Number of updates agents make to tickets | Productivity measurement and collaboration patterns |
Ticket volume is your foundational metric. It tells you how much work is coming in and whether your team is keeping up. Look for trends (is volume growing 10% month over month?) and patterns (do you get spikes on Mondays or after product releases?).
First reply time measures responsiveness. Customers expect fast acknowledgment, even if resolution takes longer. Industry benchmarks vary, but most teams aim for under a few hours for email and under a minute for chat.
Full resolution time shows your overall efficiency. Long resolution times might indicate complex issues, understaffing, or process bottlenecks. Track this alongside first reply time to see if you're responsive but slow to resolve, or vice versa.
CSAT (customer satisfaction) is the ultimate quality metric. It measures whether customers are happy with the support they received. Low CSAT with fast resolution times suggests your solutions aren't actually solving problems. High CSAT with slow times might mean customers value thoroughness over speed.
Agent touches measures work effort, not just outcomes. An agent who solves 50 tickets with 200 touches is working differently than one who solves 50 tickets with 75 touches. This helps you understand collaboration, investigation effort, and process complexity in your Zendesk reporting basics analysis.
Building and sharing dashboards
Individual reports answer specific questions. Dashboards combine multiple reports into a single view for stakeholders who need the big picture.

To build a dashboard, start in the Dashboards library and click "New dashboard." You can add reports you've already built as widgets, arrange them visually, and resize them for clarity.
Dashboard filters let you add global controls that affect all reports on the dashboard. A date range filter at the top can change the time period for every widget at once. This is useful for letting stakeholders explore "what if we look at last quarter instead of last month."
Sharing options include:
- Internal sharing Give specific Zendesk users or groups access to view or edit
- Scheduled delivery Email dashboard PDFs on a recurring schedule (daily, weekly, monthly)
- Exporting Download individual reports as CSV or entire dashboards as PDF
Viewer permissions control what people can do:
- Admins can manage users, permissions, and create content
- Editors can create and modify reports and dashboards
- Viewers can only see prebuilt and shared dashboards
Be thoughtful about what you include in shared dashboards. A dashboard with 20 widgets overwhelms people. Aim for 5-8 key reports that tell a coherent story about your Zendesk reporting basics metrics.
Common reporting mistakes to avoid
New Explore users often make the same mistakes. Here's what to watch out for:
Choosing the wrong dataset is the most common error. If you're trying to report on agent updates and comments but using the Tickets dataset, your numbers will be wrong. The Tickets dataset counts tickets. The Updates History dataset counts updates. They serve different purposes.
Forgetting to filter by time period produces reports that include every ticket ever created. Always add a time filter unless you genuinely need all historical data.
Confusing "tickets created" with "tickets solved" leads to mismatched expectations. A report showing 100 tickets created this week and 80 solved doesn't mean you have a 20-ticket backlog. Those 80 solved tickets might have been created last month.
Not accounting for business hours versus calendar hours skews your time-based metrics. First reply time is typically measured in business hours (excluding nights and weekends), but some reports default to calendar hours. Check your settings.
Overloading dashboards with too many reports makes them unusable. Stakeholders want insights, not data dumps. If a report doesn't help answer a specific business question, leave it off the dashboard.
How eesel AI complements Zendesk reporting basics
Once you've mastered the Zendesk reporting basics, you might find yourself wanting more than historical data. While Explore excels at showing you what happened, it doesn't always tell you what to do next.
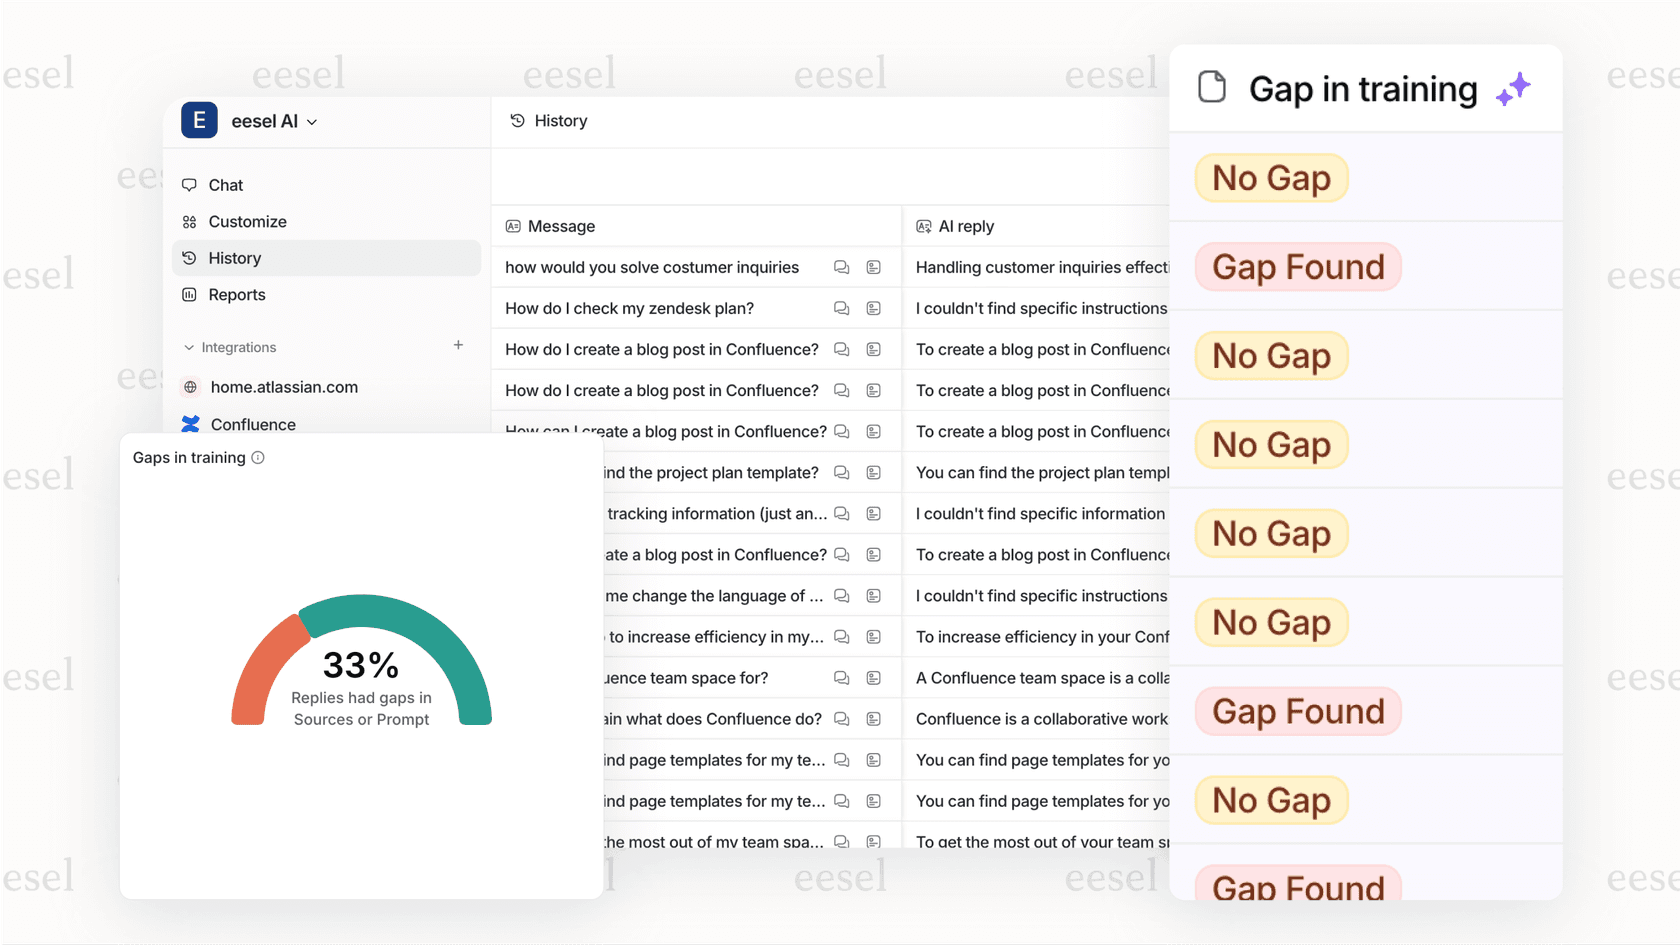
That's where eesel AI comes in. We built an AI teammate that works alongside your help desk to surface real-time insights, identify knowledge gaps, and suggest proactive actions based on patterns in your data.
Here's how eesel AI extends what you can do with Zendesk reporting basics:
- Automatic topic detection Instead of manually tagging tickets and building reports to see what customers ask about, eesel AI identifies trending topics automatically
- Knowledge gap analysis eesel AI spots questions that keep coming up but aren't covered in your help center, so you know exactly what articles to write
- Proactive recommendations Rather than waiting for you to check a dashboard, eesel AI can notify you when patterns change or issues spike
For teams that outgrow Explore's built-in capabilities, you can also integrate Zendesk with BI tools like Power BI and Tableau for deeper analysis.
If you're spending hours in Explore trying to find the story in your numbers, there might be a faster way.
Frequently Asked Questions
Share this article

Article by
Stevia Putri
Stevia Putri is a marketing generalist at eesel AI, where she helps turn powerful AI tools into stories that resonate. She’s driven by curiosity, clarity, and the human side of technology.