How to create a Zendesk CSAT report by channel
Stevia Putri
Last edited March 2, 2026
Your customers reach out through email, chat, messaging, and phone. But are you tracking satisfaction differently for each channel? Most support teams look at overall CSAT scores without realizing that channel-specific patterns tell a completely different story.
Chat conversations often score lower than email because customers expect instant responses. Voice support might have higher satisfaction but lower volume. Without breaking down your Zendesk CSAT report by channel, you're missing insights that could change how you allocate resources and train your team.
Here's how to break down exactly how to build these reports in Zendesk Explore.
What you'll need
Before diving in, make sure you've got the following set up:
- Zendesk Suite Professional or Enterprise plan Zendesk Explore requires these tiers. The Support Team plan only includes basic prebuilt dashboards.
- Admin or reporting permissions You'll need access to create and modify reports in Explore.
- CSAT surveys enabled and collecting data If you haven't activated satisfaction surveys yet, you'll need to do that first in your Zendesk Admin Center.
- Basic familiarity with Zendesk Explore You should know how to navigate to datasets and add basic metrics.
If you're on Suite Team or lower, you'll need to upgrade to access the custom reporting features covered in this guide. You can check the latest Zendesk pricing and plans to see which tier fits your needs.
Step 1: Access the CSAT dataset in Explore
Start by navigating to Reporting > Analytics > Explore from your Zendesk Admin Center. Once inside Explore, you'll need to select the right dataset to work with.
Choose the Support: Tickets dataset. This contains all your ticket data including satisfaction ratings. Don't use the "Support: Ticket Updates" dataset for CSAT reporting (that one tracks changes to tickets, not the satisfaction scores themselves).

Once you're in the Tickets dataset, look for the Satisfaction metrics section in the left sidebar. You'll see several CSAT-related metrics:
- Rated Satisfaction Tickets The count of tickets that received a rating
- Overall CSAT Score The percentage of positive ratings (Good / Total Rated)
- Good Satisfaction Tickets Count of tickets rated "Good"
- Bad Satisfaction Tickets Count of tickets rated "Bad"
For channel reporting, you'll primarily use "Overall CSAT Score" as your main metric, with "Rated Satisfaction Tickets" to understand response volume.
Step 2: Add channel attributes to your report
Now it's time to slice your data by channel. In the left sidebar, find the Ticket Channel attribute under the "Ticket" section. Drag this into the Columns or Rows area depending on how you want to visualize the data.
Zendesk categorizes tickets into these channels:
- Email Tickets created via email
- Chat Live chat conversations
- Messaging Web widget, mobile SDK, and social messaging
- Voice Phone calls via Zendesk Talk
- Web Form Tickets submitted through your help center contact form
- API Tickets created programmatically

Next, add the Satisfaction Rating attribute. This breaks down responses into "Good" and "Bad" ratings. Place this in the opposite axis from your channel attribute (if channels are in rows, put satisfaction in columns).
Here's the short version: you're building a matrix that shows Good vs Bad ratings for each channel. This lets you quickly spot which channels are performing well and which need attention.
Step 3: Configure your report visualization
With your metrics and attributes in place, it's time to choose how to display the data. The right visualization makes patterns obvious at a glance.
For channel comparison, a bar chart works best. It lets you compare CSAT scores across channels side by side. If you want to track trends over time, switch to a line chart with channels as different colored lines.
Add these filters to make your report more useful:
- Date range Start with the last 30 days, but make it adjustable
- Ticket Group Filter by specific teams if you have multiple groups
- Ticket Status Usually you'll want Solved and Closed tickets only
Set up comparison periods to spot trends. In Explore, you can add time-based comparisons like week-over-week or month-over-month. This helps you identify whether a channel's CSAT is improving or declining.
Best practice: Keep the visualization simple. Don't try to show more than 5-6 channels in one chart. If you have many channels, create separate reports or use filters to let users focus on specific ones.
Step 4: Analyze your channel CSAT data
Once your report is running, it's time to interpret what you're seeing. Here's what to look for:
Response rate variations Not all channels get the same survey completion rates. Email typically has higher response rates (customers have time to click), while chat and voice often have lower rates (the interaction ends quickly). A channel with low CSAT but high response rate needs immediate attention. A channel with low response rates might need survey timing adjustments.
Common patterns to expect:
- Email Usually higher CSAT because customers expect longer response times
- Chat Often lower CSAT due to speed expectations and concurrent chat handling
- Messaging Similar to chat but can vary based on async vs sync usage
- Voice Typically higher CSAT when issues are resolved, lower when transferred multiple times
If you see a channel consistently underperforming, dig deeper. Look at first reply times, resolution times, and agent workload for that specific channel. Sometimes the issue isn't the channel itself but how your team is staffed to handle it.
Step 5: Set up automated channel reporting
Building the report is just the start. To actually use this data, you've got to get it in front of the right people regularly.
Create a dashboard in Explore that combines your channel CSAT report with related metrics like ticket volume by channel and first reply time by channel. This gives stakeholders context when they see a CSAT drop.
Schedule email deliveries to keep your team informed:
- Click the share icon on your dashboard
- Select "Schedule delivery"
- Set the frequency (weekly works well for CSAT tracking)
- Add recipients (team leads, managers, executives)
- Include a brief description of what the report shows
Set up visual data alerts for CSAT drops. In Zendesk Explore, you can configure alerts that trigger when a channel's CSAT falls below a threshold you define. This proactive notification means you can address issues before they become trends.
Handling cross-channel customer journeys
Here's a challenge Zendesk doesn't solve natively: customers who switch channels mid-issue. A customer might email, then call when they don't get a quick response, then chat for a follow-up. Each interaction creates a separate ticket with its own CSAT survey.
This fragmentation makes it tough to get a true picture of customer satisfaction. The customer might rate the email interaction poorly (slow response) but the call positively (quick resolution). Your reports show mixed signals.
Workarounds that help:
- Time-window analysis Look at tickets from the same customer within 24-48 hours. Group these mentally (or via tags) as related interactions.
- Requester-based filtering Create reports that show all tickets from customers who submitted multiple tickets in a short period.
- Tagging strategy Use Zendesk triggers to tag tickets as "follow-up" when a customer has an existing open ticket. This won't catch everything but helps identify some patterns.
Bottom line: cross-channel tracking is a known limitation. Document this gap when presenting CSAT data to stakeholders so they understand the full context.
Enhancing channel insights with AI
Native Zendesk CSAT reporting tells you what happened. But it doesn't tell you why, and it doesn't help you prevent problems before they start.
This is where AI-powered analysis becomes valuable. While your CSAT surveys capture feedback after the interaction, AI can analyze conversations in real time to identify sentiment shifts, confusing responses, or escalation risks while the ticket's still open.
At eesel AI, we've seen teams use AI to supplement their channel reporting in several ways:
- Real-time sentiment tracking Identify conversations going off track before they result in bad CSAT
- Pattern recognition Spot which types of issues on which channels consistently lead to poor ratings
- Proactive intervention Route at-risk conversations to senior agents before the survey goes out
Unlike native CSAT which is reactive (you find out after the customer's already dissatisfied), AI analysis lets you intervene while you can still turn the interaction around.

If you're already using Zendesk Explore for CSAT reporting, adding an AI layer for real-time sentiment analysis gives you both the historical view and the proactive capability. The two approaches complement each other.
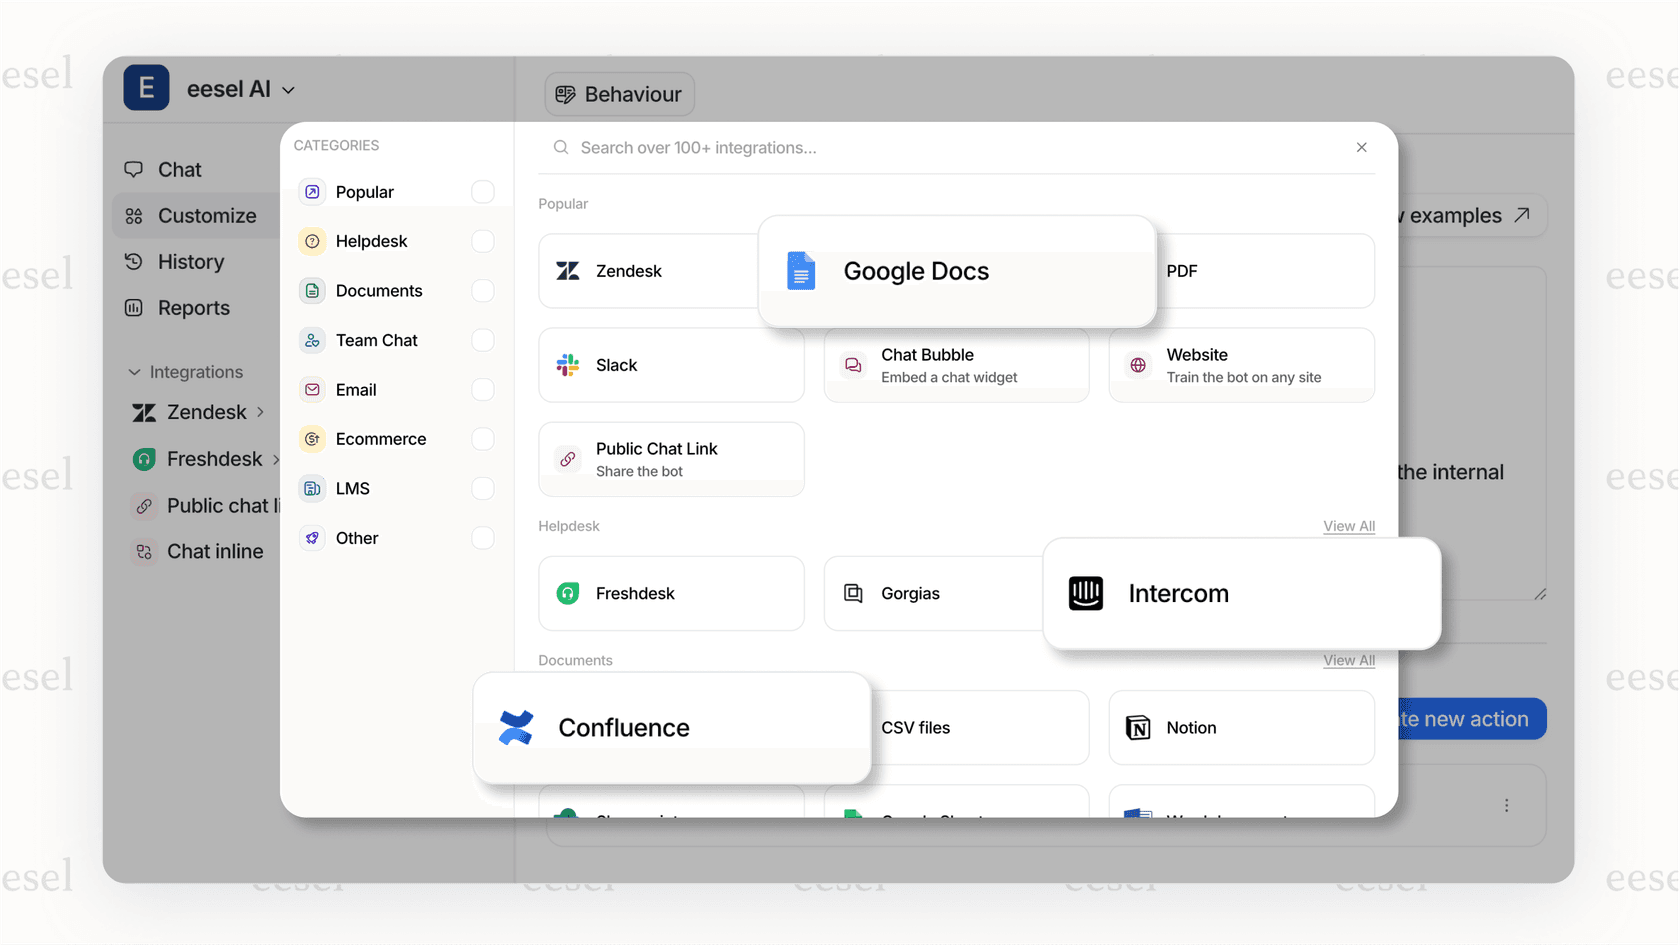
eesel AI works alongside Zendesk to provide real-time sentiment analysis, automated ticket triage, and AI-powered response drafting. It learns from your past tickets and help center content to understand your business context.
Channel-specific optimization tips
Once you have your reports running, here's how to improve CSAT on each channel:
Email:
- Focus on first reply time. Customers who wait days for an initial response rarely give good ratings.
- Review template effectiveness. If you're using macros, track which ones correlate with good vs bad ratings.
- Set clear expectations. If resolution takes time, communicate that upfront.
Chat:
- Monitor concurrent chat limits. Agents handling too many chats simultaneously deliver worse experiences.
- Track response speed within conversations. Long pauses mid-chat frustrate customers.
- Use typing indicators and status updates so customers know agents are still there.
Messaging:
- Optimize for asynchronous flow. Unlike chat, customers don't expect instant responses on messaging.
- Leverage rich media. Messaging supports images, carousels, and quick replies that can improve clarity.
- Consider conversation continuity. Customers may pick up conversations hours later.
Voice:
- Track hold times and transfers. These are the biggest drivers of poor phone CSAT.
- Monitor resolution efficiency. First-call resolution strongly correlates with satisfaction.
- Use call wrap-up time effectively. Agents need time to document, but long delays frustrate customers waiting in queue.
Troubleshooting common issues
Even with the right setup, you'll run into issues. Here's how to handle the most common ones:
Missing channel data If tickets show as "Unknown" channel, check how those tickets are being created. API-created tickets or tickets from certain integrations sometimes don't inherit channel metadata correctly. You may need to use tags or custom fields as a workaround.
Discrepancies between channel CSAT and overall scores This is usually due to volume differences. If email represents 80% of your tickets but has 90% CSAT, and chat is 20% of tickets with 70% CSAT, your overall CSAT will be around 86%. The weighted average matters more than simple averages.
Data freshness delays Remember that Zendesk Explore refresh rates vary by plan. Suite Professional refreshes hourly; Suite Enterprise offers real-time for live dashboards. If you need up-to-the-minute data for a critical issue, you may need to upgrade or use a different reporting approach. Check the Zendesk pricing page for current refresh rate details.
Low response rates on certain channels This is common for chat and voice. Consider adjusting when surveys are sent or adding follow-up surveys for these channels specifically.
Start improving your channel CSAT today
You now have a complete process for building channel-specific CSAT reports in Zendesk Explore. The key steps are:
- Access the Support: Tickets dataset in Explore
- Add Ticket Channel and Satisfaction Rating attributes
- Configure visualizations that make patterns obvious
- Analyze the data to identify underperforming channels
- Set up automated reporting to keep stakeholders informed
Channel-based analysis reveals insights that aggregate CSAT hides. Email might be performing great while chat struggles. Voice could have high satisfaction but low volume worth expanding. These patterns guide where you invest training, staffing, and process improvements.
If you want to go beyond reactive reporting and start preventing bad CSAT before it happens, consider how AI can supplement your Zendesk setup. Real-time sentiment analysis and proactive escalation can catch at-risk conversations while you can still save them.
Ready to explore AI-powered support insights? See how eesel AI works with Zendesk to enhance your customer satisfaction capabilities. You can also try eesel AI free and see how it learns from your existing tickets and help center content.
Frequently Asked Questions
Share this article

Article by
Stevia Putri
Stevia Putri is a marketing generalist at eesel AI, where she helps turn powerful AI tools into stories that resonate. She’s driven by curiosity, clarity, and the human side of technology.