Understanding your customer service performance isn't optional anymore. It's the difference between teams that scale efficiently and those that drown in ticket volume. Kustomer has built a reporting ecosystem that aims to give CX leaders visibility into every corner of their operation, from real-time queue health to AI-powered insights that explain why metrics are moving.
Let's break down what Kustomer reporting actually offers, how it works, and where it might fall short for your specific needs.
What is Kustomer reporting?
Kustomer is an AI-powered customer service CRM platform that combines unified customer data, omnichannel messaging, and automation in one workspace. The reporting capabilities are built directly into this ecosystem rather than being an afterthought or separate product.
At its core, Kustomer reporting serves two audiences: managers who need operational visibility and executives who want strategic insights. The platform splits its analytics into two main categories: standard reports that work out of the box, and custom reports that you build to match your specific KPIs. More recently, Kustomer added Data Explorer, an AI-powered tool that lets you ask questions in natural language instead of clicking through dashboards.
Access to reporting isn't universal. Managers or users with custom permission sets can view reports, which means you'll need to think about who gets access as part of your implementation.
Standard reports in Kustomer
Kustomer ships with five pre-built reports that cover the fundamentals of CX operations. Each serves a distinct purpose and tracks metrics that most support teams care about.
Overview report
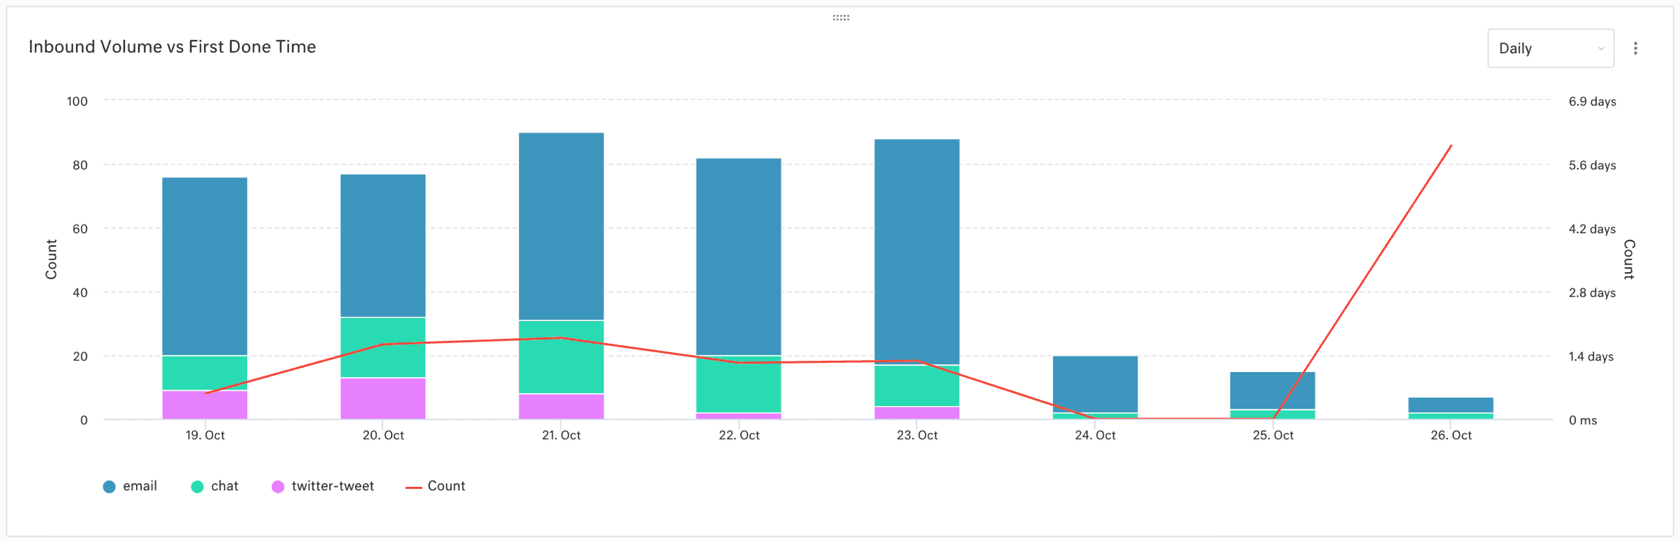
The Overview report is your high-level operational dashboard. It tracks inbound customers, inbound conversations, average handle time, and resolution times across your organization. You get a breakdown of which channels are driving the most traffic (email, chat, SMS, voice, social) and how conversation volume trends over time.
This is the report you pull up in leadership meetings to show the health of your support operation at a glance.
Conversation report
Where the Overview report shows volume, the Conversation report shows efficiency. It tracks response times, resolution times, first contact resolution rate, and handle time. The heatmap showing inbound messages by day and hour helps you identify peak times and staff accordingly.
First contact resolution is calculated as a percentage of inbound conversations that are marked done, contain at least one message, and have never been reopened or merged. It's a stricter definition than some platforms use, which matters when you're benchmarking against industry standards.
SLA report
If you have service level agreements with customers or internal targets, the SLA report tracks how you're performing against them. It shows conversations in policy, percentage achieved, and breached conversations. You can drill down into specific SLA policies to see where failures are happening.
One quirk to note: if a conversation matches a policy with two metrics and one breaches, the entire conversation shows as breached. This can make your breach rate look higher than you might expect if you're coming from a different platform.
Knowledge Base report
For teams using Kustomer's knowledge base, this report tracks self-service effectiveness. You get total view counts, average article ratings, and searches with no results (indicating content gaps). The Article Performance table shows which articles are trending up or down, and the Search Queries table reveals what customers are actually looking for.
Metrics here update after 30 minutes or 1,000 views, whichever comes first. This isn't real-time data, so don't expect to see immediate impact from content changes.
Team Pulse dashboard
Team Pulse is Kustomer's real-time operational command center. It shows agent status, current capacity, what agents are working on, and queue health. You can see average wait times, latest wait times, and how many agents are available to take work.
The standout feature here is the ability to transfer agents between teams when one queue is overloaded and another has capacity. It's a manual process, but it gives supervisors direct control over workload balancing.
Custom reporting capabilities
When standard reports don't cut it, Kustomer's custom report builder lets you build exactly what you need. The Chart Editor supports multiple visualization types: column, line, stacked column, area, stacked area, pie, table, and KPI cards.
Building a report starts with selecting a dataset (conversations, messages, customers, teams, custom objects) and then choosing a metric from that dataset. You can aggregate data by average, distinct count, max, median, min, or sum. Segmentation lets you break metrics down by categories like channel, team, agent, or custom attributes.
Time attribution is flexible. You can anchor data to created at, deleted at, last activity, last customer activity, last message, or several other timestamps. Time intervals range from per-minute granularity up to monthly views.
One useful feature is the ability to add second queries to charts for comparison metrics. This works with line charts and lets you plot two different metrics on the same visualization with dual y-axes.
Custom reports can be organized with up to two charts per row, and you can drag and drop to rearrange. Reports can be shared with specific users or teams, though permissions depend on your plan level.
Data Explorer: AI-powered analytics
Launched in December 2025, Data Explorer represents Kustomer's bet on natural language interfaces for analytics. Instead of building charts manually, you type questions like "Why did chat response times spike last week?" and get structured responses with visualizations, explanations, and suggested actions.
Data Explorer comes with over 250 guided prompts organized by analysis category. Common use cases include rep scorecards, capacity and backlog analysis, benchmarking across teams or channels, volume forecasting, and voice-of-customer insights using sentiment data.
The system highlights drivers, outliers, and anomalies that affect staffing, service quality, and efficiency. Each insight includes operational next steps, such as routing updates, staffing changes, or targeted agent coaching. You can export results to PDF or copy a shareable URL to send to colleagues.
Early adopters like Goody, a modern gifting platform, report significant time savings. Their CX team uses Data Explorer for weekly reviews that previously required manual reporting. They analyze tags for behavior trends, break down CSAT drivers, review agent-level performance, and surface new customer themes.

Understanding Kustomer metrics
Kustomer provides detailed documentation on how each metric is calculated, which matters when you're building custom reports or trying to match numbers to other systems.
Response time metrics use business hours by default, not calendar hours. First response time is the duration between the first inbound message and the first outbound reply. If the initial inbound message is handled by a Customer Assist feature, it's calculated from when the conversation enters the queue instead.
Resolution time has two flavors: first marked done (the first time a conversation is closed) and last marked done (the most recent close). First contact resolution rate is strict: it only counts conversations that were resolved on the first interaction, never reopened, and never merged.
Handle time is calculated as the cumulative time agents spend viewing conversations, divided by the count of unique conversations viewed. This measures active engagement time, not just time until resolution.
Sentiment analysis uses Amazon Comprehend's NLP engine. Individual messages get scored, and conversation or customer sentiment is the average of those message scores. This happens automatically on message creation.
Limitations and considerations
Kustomer reporting is powerful, but it's not without constraints. Understanding these upfront helps you decide if it's the right fit.
Pricing and access: Reporting features require either the Enterprise plan ($89 per seat/month) or Ultimate plan ($139 per seat/month). Both require a minimum of 8 seats billed annually, which puts Kustomer out of reach for smaller teams. Contact sales if you need fewer seats.
Data delays: Knowledge Base metrics update after 30 minutes or 1,000 views. This lag means you can't see immediate impact from content changes. Custom report data may also have refresh delays depending on your plan.
Permission complexity: Access to reports isn't automatic. You need to be a manager or have a custom permission set with reporting access. This adds administrative overhead when onboarding new team members who need analytics access.
Learning curve: The custom report builder, while flexible, requires understanding of datasets, metrics, aggregations, and time attribution. Teams without data-savvy members may struggle to build meaningful custom reports without training.
Integration limits: While Kustomer offers integrations with common tools, exporting data to external BI platforms like Tableau or Looker requires API work. There's no native connector for popular business intelligence tools.
Queue and object limits: Enterprise plans are capped at 3 queues per team and 5 million custom objects. Ultimate raises these to 10 queues per team and 100 million objects. If you're running complex operations with many specialized queues, these limits matter.
Alternative approaches to CX analytics
Kustomer reporting works well for teams already invested in the Kustomer ecosystem who want integrated analytics. But it's not the only approach to understanding your customer service performance.
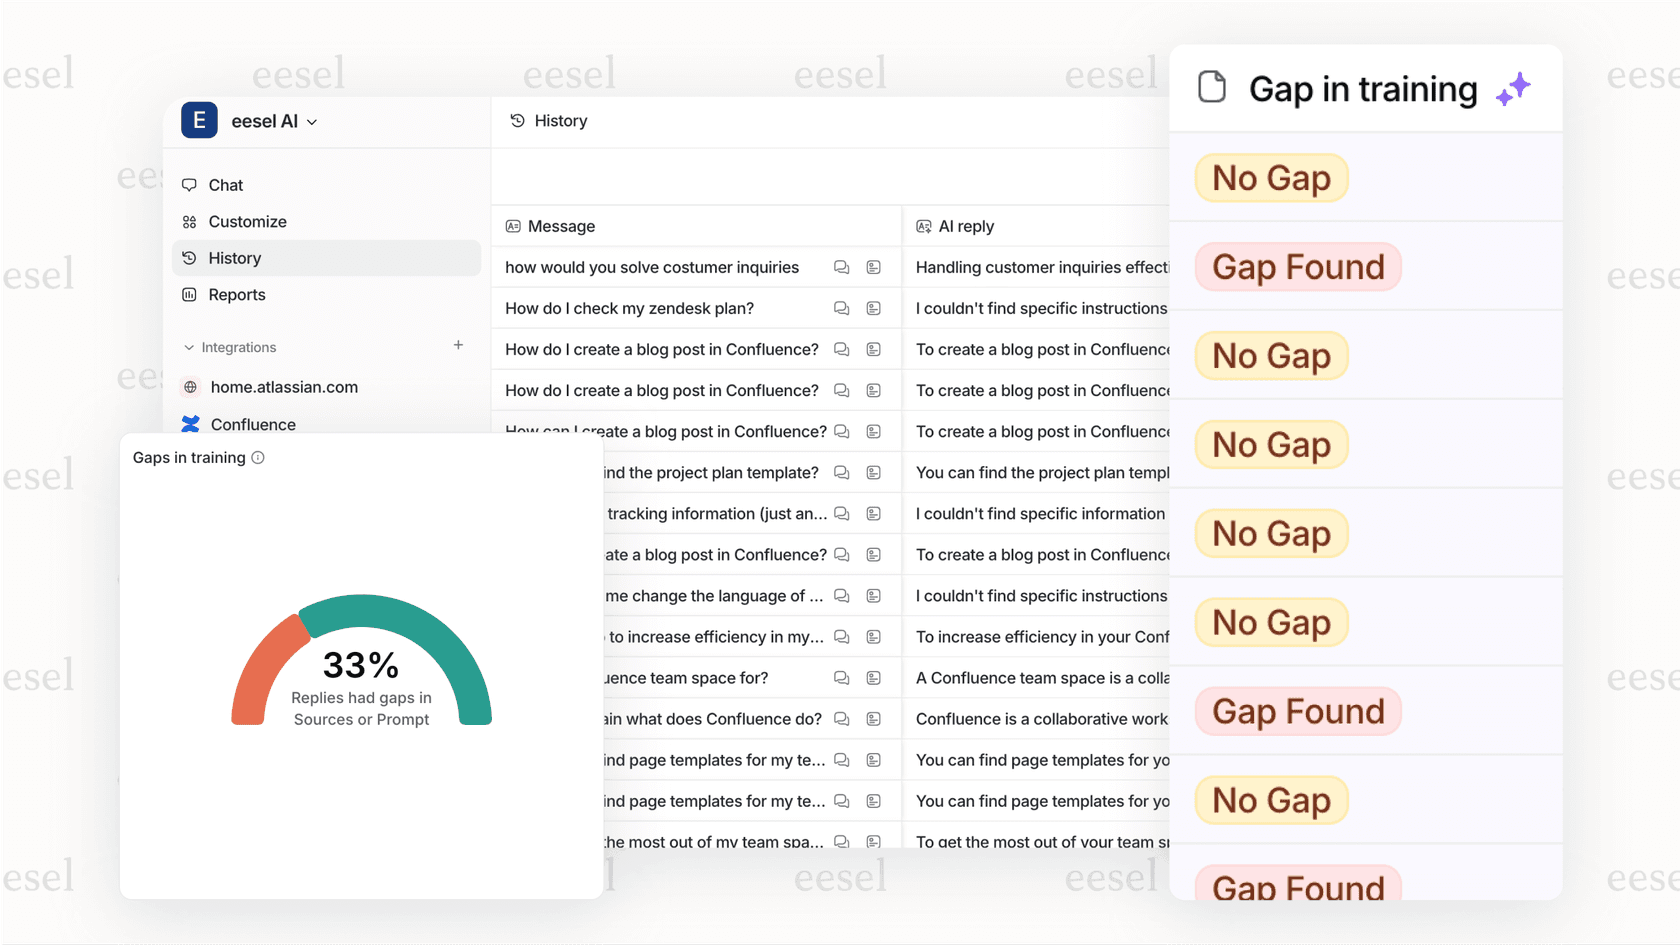
At eesel AI, we take a different approach to CX analytics. Instead of requiring you to build reports manually or learn a query interface, our AI learns from your past tickets, help center articles, and conversations automatically. The system identifies patterns, detects knowledge gaps, and surfaces insights without you asking for them.
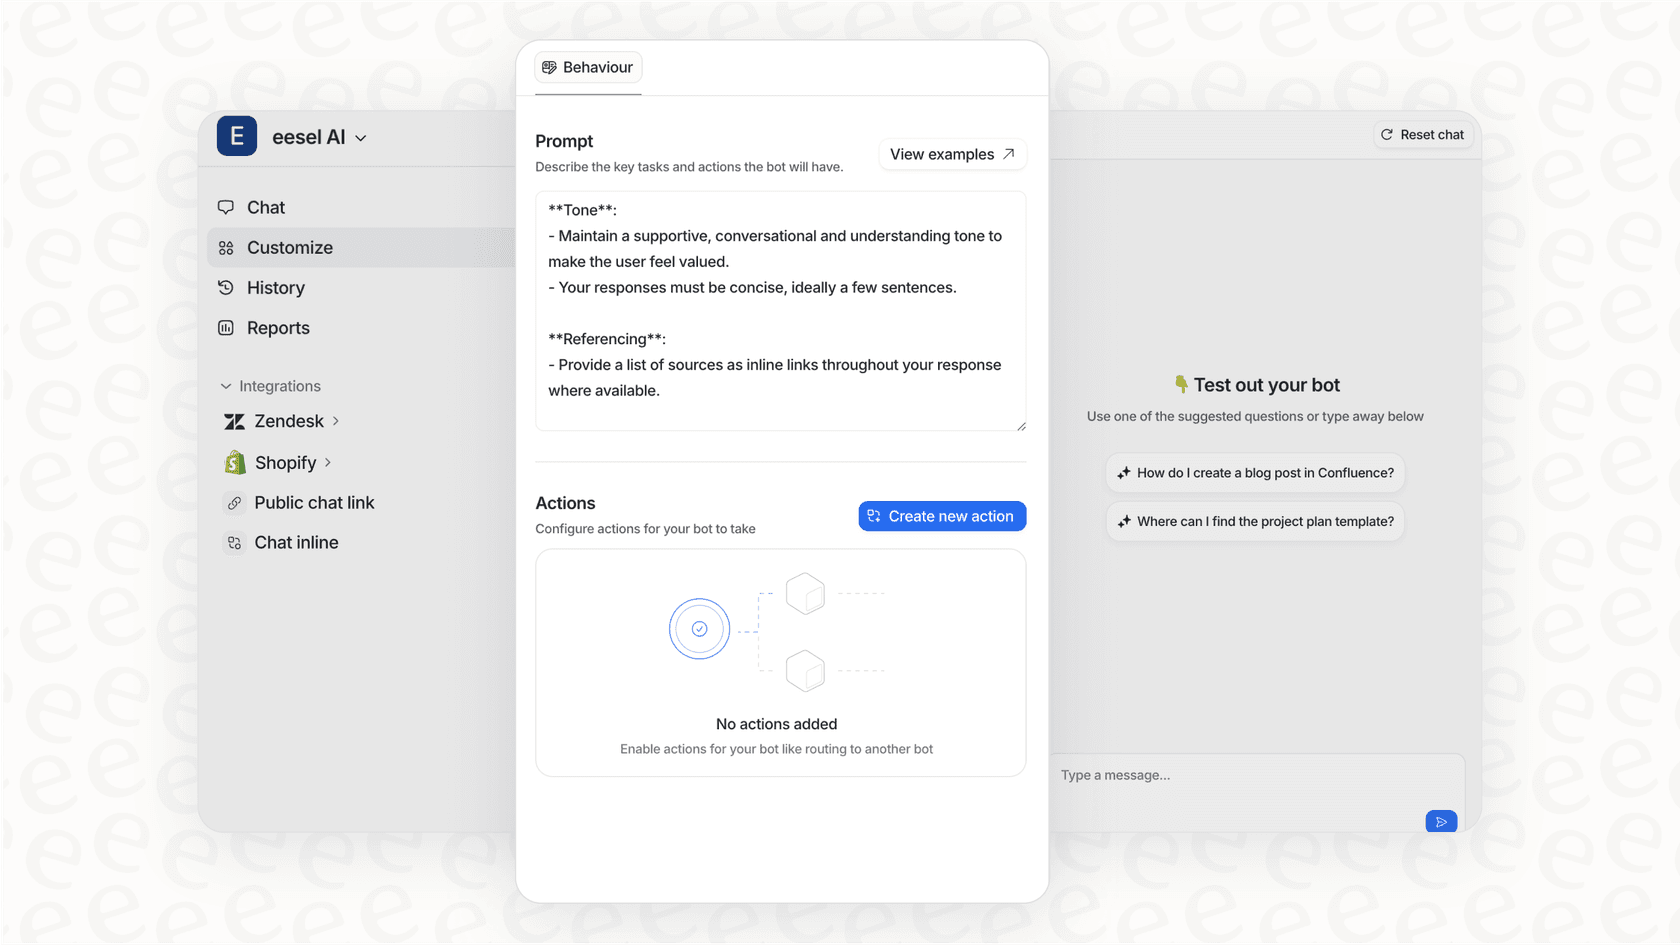
The key difference is autonomy. Kustomer's Data Explorer responds to your questions. Our AI agent proactively identifies what's working, what isn't, and what you should do about it. We also offer simulation capabilities that let you test how the AI would handle past tickets before going live, something Kustomer doesn't provide.
For teams comparing options, our guide to top AI customer service tools breaks down how different platforms approach analytics and automation. Our AI agent product handles end-to-end ticket resolution with built-in reporting on resolution rates, customer satisfaction, and knowledge gaps.
Pricing is another differentiator. Kustomer's seat-based model with 8-seat minimums targets larger organizations. We offer usage-based pricing that scales with your actual volume, which can be more predictable for growing teams.
Getting the most from your CX reporting
Whether you choose Kustomer or another platform, a few principles help you get value from your analytics investment.
Start with the questions that matter. Don't build reports because the data is available. Build them because the answers drive decisions. If a metric doesn't lead to action, it's just noise.
Combine quantitative data with qualitative feedback. A spike in first response time tells you something changed. Follow-up conversations with agents tell you why. Both pieces matter.
Share insights widely. The best CX organizations make performance data visible to everyone, not just managers. When agents see how their work contributes to team goals, engagement improves.
Review and refine regularly. The reports you needed six months ago may not be the ones you need now. Schedule quarterly reviews of your reporting setup and retire dashboards that no longer serve a purpose.
Choosing the right reporting approach for your team
Kustomer reporting offers a solid foundation for CX analytics, especially if you're already using Kustomer as your primary support platform. The standard reports cover operational fundamentals, custom reporting provides flexibility for specific KPIs, and Data Explorer adds AI-powered insights for teams ready to adopt natural language interfaces.
The platform fits mid-size to enterprise teams with dedicated CX operations staff who can build and maintain custom reports. The 8-seat minimum and per-seat pricing model make it less suitable for smaller organizations or teams with seasonal staffing fluctuations.
For teams seeking autonomous AI that learns continuously, identifies knowledge gaps automatically, and handles ticket resolution end-to-end, alternatives like eesel AI offer a different philosophy. The choice depends on whether you want a tool that responds to your questions or one that proactively improves your operation.
Either way, the investment in CX analytics pays dividends. Teams that understand their performance patterns make better staffing decisions, identify training needs faster, and deliver consistently better customer experiences. The question isn't whether to invest in reporting. It's which approach fits your team's workflow, technical capabilities, and growth trajectory.
Frequently Asked Questions
Share this article

Article by
Stevia Putri
Stevia Putri is a marketing generalist at eesel AI, where she helps turn powerful AI tools into stories that resonate. She’s driven by curiosity, clarity, and the human side of technology.