2026年版 Zendesk レポーティングツール選びの完全ガイド
Kenneth Pangan
Stanley Nicholas
最終更新 January 12, 2026

正直に言って、優れたカスタマーサポートは優れたデータに基づいています。適切なレポートは、単に数字を提示するだけではありません。顧客が何を必要としているのか、チームの強みはどこにあるのか、そしてワークフローをどのように最適化できるのかという「ストーリー」を教えてくれます。それは、次に何をすべきかを推測するのと、実際に把握しているのとの違いです。
適切な Zendesk レポーティングツール (reporting tool) を選ぶことは、サポート業務をプロフェッショナル化するための重要なステップです。チームの成功を包括的に把握できると同時に、今すぐ状況をさらに改善するために役立つインサイトを提供してくれるものが必要です。
このガイドでは、Zendesk 独自の強力なレポーティングツールについて詳しく解説し、その優れた機能を紹介します。また、データを補完し、レポートを成功へのプレイブック(戦略書)に変えるための、最新の AI を活用した方法についても紹介します。
Zendesk レポーティングツールとは何ですか?
本質的に、Zendesk レポーティングツールとは、カスタマーサービスチームにとって重要な主要指標(メトリクス)を測定し、意味を見出すためのものです。チケット、チャット、通話から得られる膨大な生のデータを、明確に理解し、行動に移せる形に変換するためのシステムです。
ここでの主役は、プラットフォームに組み込まれた分析ツールである Zendesk Explore です。これは、Zendesk アカウントから直接データを抽出し、直感的なダッシュボードに表示するように設計された、成熟した信頼性の高いプラットフォームです。
Explore は強力なネイティブオプションですが、ニーズの進化に合わせて補完的なツールを追加することを選択するチームも多くあります。これは多くの場合、カスタマージャーニーのさらに広い全体像を把握するために、他の専門的なプラットフォームからのデータを取り込みたいという要望があるためです。
優れたレポーティングツールは、以下のような不可欠な要素を監視するのに役立ちます。
-
初回回答時間 (FRT): チームはどれくらい迅速に顧客とコンタクトを取れていますか?
-
平均解決時間: チケットが作成されてから「問題解決」に至るまで、プロセスはどれくらい効率的ですか?
-
顧客満足度 (CSAT): 顧客は提供された高品質なサポートに満足していますか?
-
チャネル別チケット件数: 顧客はメール、チャット、電話のどれを利用していますか?リソースをどこに最適に配分すべきでしょうか?
-
エージェントのパフォーマンス: 誰がチームを牽引しており、誰にさらなるスキルアップの機会が必要ですか?
Zendesk Explore の機能を深掘りする
Zendesk Explore は、特に Zendesk のエコシステム向けに構築されているため、非常に有能で優れたツールです。外部のソフトウェアをすぐに探す必要なく、サポートデータを理解するための強力でプロフェッショナルな出発点を提供してくれます。
プリセットのダッシュボードとレポート
インストールしてすぐに、Explore は Support、Talk、Chat、Guide といった Zendesk 製品向けの複数の作成済みダッシュボードを提供します。これは、迅速に運用を開始するのに非常に適しています。数分以内に、チケット件数、エージェントの活動、CSAT スコアをプロフェッショナルな視点で確認できます。
これらのダッシュボードは、業界の重要な指標に基づいて構築されており、非常に便利です。すべてのチームが必要なものを確実に手に入れられるよう、Zendesk はこれらを基本機能として提供しています。上位プランでは、戦略がより複雑になるにつれて、これらのレポートをカスタマイズおよび編集できる柔軟性がさらに高まります。
カスタムレポートとデータセット
Professional 以上のプランを利用しているチーム向けに、Explore は独自のカスタムレポートを作成する機能を提供しています。これは、データセット (datasets)、メトリック (metrics)、属性 (attributes) に基づいて構築された高度なシステムです。
-
データセットは、整理された Zendesk データのバケツのようなものです(すべてのチケット情報やユーザープロフィールなど)。
-
メトリックは、追跡する主要な数値です(解決済みチケットの数や平均返信時間など)。
-
属性は、データを細分化するために使用するフィルターです(エージェント名、チケットチャネル、優先度レベルなど)。
この設定はデータ主導のチームに絶大な柔軟性を提供しますが、その深い機能を習得する時間を惜しまない人に応えてくれるプロ仕様のツールでもあります。自らデータアナリストとして活動したいマネージャーにとって、強力な環境となります。
Zendesk Explore: 価格とプラン
利用できるレポーティング機能は、Zendesk Suite プランに合わせて拡張されるように設計されています。この階層型アプローチの利点は、必要な複雑さに応じて料金を支払えばよく、チームの成長に合わせてより多くの機能を解放できる点にあります。リアルタイムデータや高度なダッシュボード共有などの機能は、エンタープライズ向けのプランで利用可能になります。
2026年時点での、各レベルで利用可能な機能の概要は以下の通りです。
| 機能 | Suite Team(月額$55/エージェント) | Suite Professional(月額$115/エージェント) | Suite Enterprise(月額$169/エージェント) |
|---|---|---|---|
| プリセットのダッシュボード | あり | あり | あり |
| カスタムレポート | なし | あり | あり |
| データ更新頻度 | 24時間 | 1時間 | リアルタイム(ライブダッシュボード) |
| ダッシュボードの共有 | なし | Zendeskユーザーのみ | Zendeskユーザーおよびエンドユーザー |
| ライブダッシュボード | なし | デフォルトビュー | カスタマイズ可能なビュー |
| カスタムロールと権限 | なし | なし | あり |
ご覧の通り、独自のレポートを作成する能力や、より頻繁なデータ更新へのアクセスは、Professional および Enterprise エクスペリエンスの標準的な機能となっています。
従来の Zendesk レポーティングツールの検討事項
Zendesk Explore のように成熟したプラットフォームであっても、サポートリーダーはしばしば分析を拡張する方法を模索します。多くの場合、これはツール自体の問題ではなく、意思決定プロセスにより多くのデータソースを統合したいという要望によるものです。
プラットフォーム間でのデータ管理
Zendesk Explore は、Zendesk エコシステム内のデータを分析することに関しては世界クラスです。しかし、サポートチームは多くの場合、さまざまなツールを使用しています。完全な全体像を把握するには、Confluence のページ、Google ドキュメント、Notion のウィキ、あるいは Slack のスレッドからの情報が必要になる場合があります。
可能な限り広い視野を得るために、一部のチームは補完的な AI プラットフォームの使用を選択しています。eesel AI のようなツールは Zendesk と連携するように設計されており、100 以上の他のアプリと統合して、チケットデータとともにナレッジソースの統合ビューを提供します。
プロフェッショナルグレードのパワーとカスタマイズ
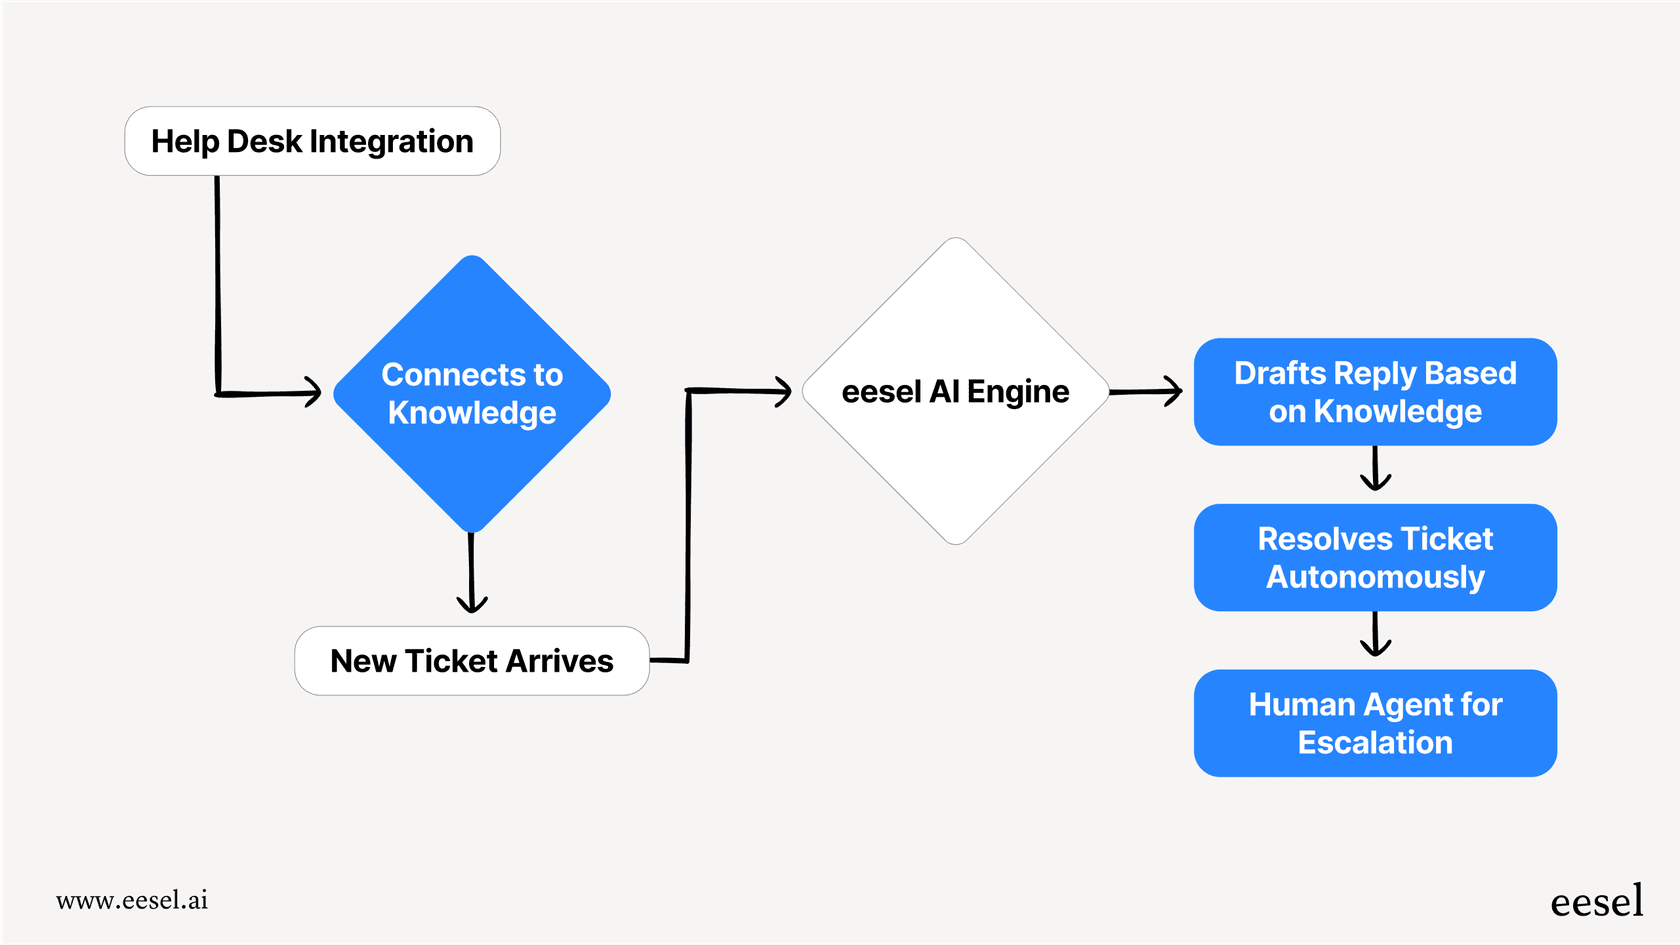
前述の通り、Explore は多くの機能を備えた強力なツールです。特別なデータトレーニングを必要とせずに、さらに迅速に行動したいチームにとって、補完的なオプションが役立ちます。例えば eesel AI を使用すると、ヘルプデスクとナレッジソースを迅速に接続でき、サポートマネージャーがすぐにインサイトを得られるユーザーフレンドリーな方法を提供します。
リアクティブなデータに先見的なインサイトを加える
従来のダッシュボードは、過去に何が起こったかを正確に示すことに長けています。CSAT の低下やボリュームの増加といった「何が起きたか(What)」を提供します。
「なぜ起きたか(Why)」をより速く見つけるために、多くのチームが AI に注目しています。
レポートに「請求に関する問題」の傾向が表示された場合、AI 駆動型のツールは、ガイド内の特定の文章など、正確な根本原因を特定するのに役立ちます。これにより、チケットの発生源をプロアクティブに修正できます。これは、Zendesk が提供する基盤を強化する素晴らしい方法です。
ダッシュボードの先へ:AI を使用して Zendesk レポーティングツールを補完する
AI を、Zendesk データと連携して次にとるべき最善の策を提案するインテリジェンス・レイヤーだと考えてください。eesel AI のようなプラットフォームは、現在の設定に対する強力な追加機能として設計されており、数字を積極的な改善へと変える手助けをします。
自信を持って展開するためのパフォーマンス・シミュレーション
新しい自動化やレポーティング戦略を試す準備ができたら、それをテストする方法があるのは素晴らしいことです。標準的なツールは過去の結果を示しますが、eesel AI のシミュレーションモードでは将来を見通すことができます。サンドボックス内で過去数千件のチケットに対して設定を実行し、パフォーマンスと潜在的なコスト削減に関するデータに基づいた予測を提供します。戦略に完全な自信を持って前進するための優れた方法です。
ナレッジのギャップを自動的に特定して埋める
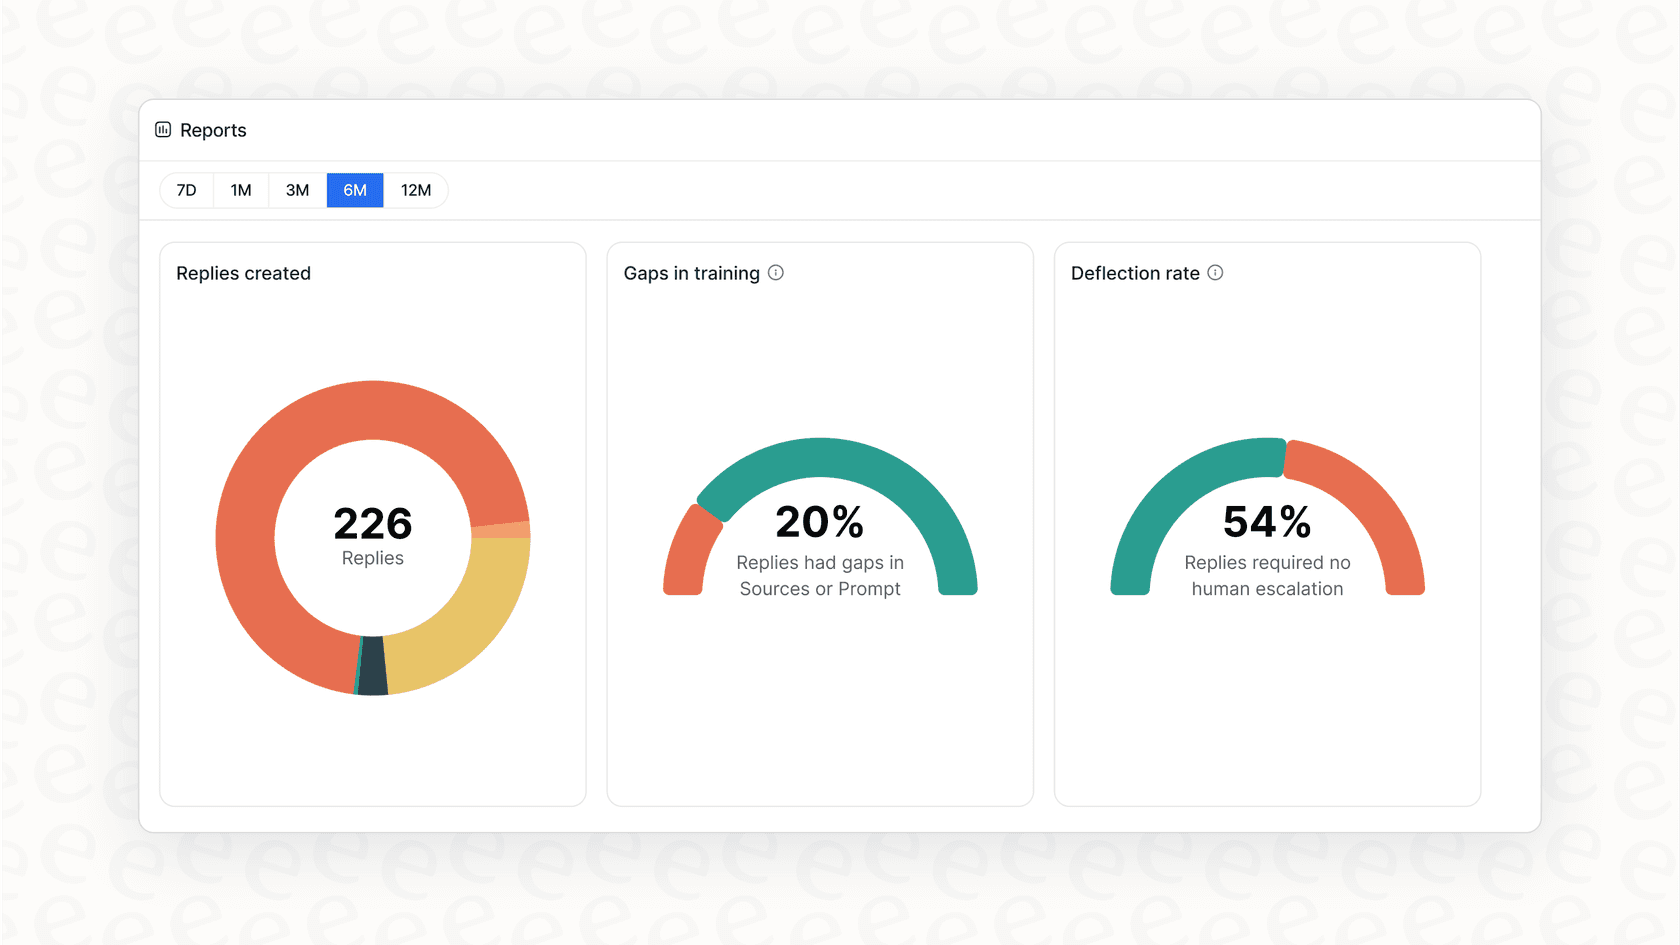
現代的なレポーティング戦略は、ヘルプセンターのどこをさらに強化できるかを把握するのに役立つはずです。eesel AI の分析ダッシュボードは、現在の記事ではまだカバーされていない質問をハイライトすることで、Zendesk を補完します。
さらに、「ナレッジベース自動生成機能」を使用すると、人間のエージェントによる解決成功例を取り込み、それをナレッジベースの記事の下書きに変換できます。これにより、AI がチームの最良の仕事から学び、ナレッジベースが常に成長し改善し続けるポジティブなサイクルが生まれます。
その仕組みは以下の通りです。
-
顧客がユニークまたは複雑な質問をします。
-
システムは、現在のナレッジベースに回答がないことを特定し、エージェントにルーティングします。
-
プロフェッショナルなエージェントが優れた解決策を提供します。
-
eesel AI がその成功したやり取りを分析します。
-
その返信に基づいて記事の下書きを自動的に作成します。あなたはそれを確認して公開するだけで、将来の顧客を助けることができます。
ワークフローエンジンで結果をカスタマイズする
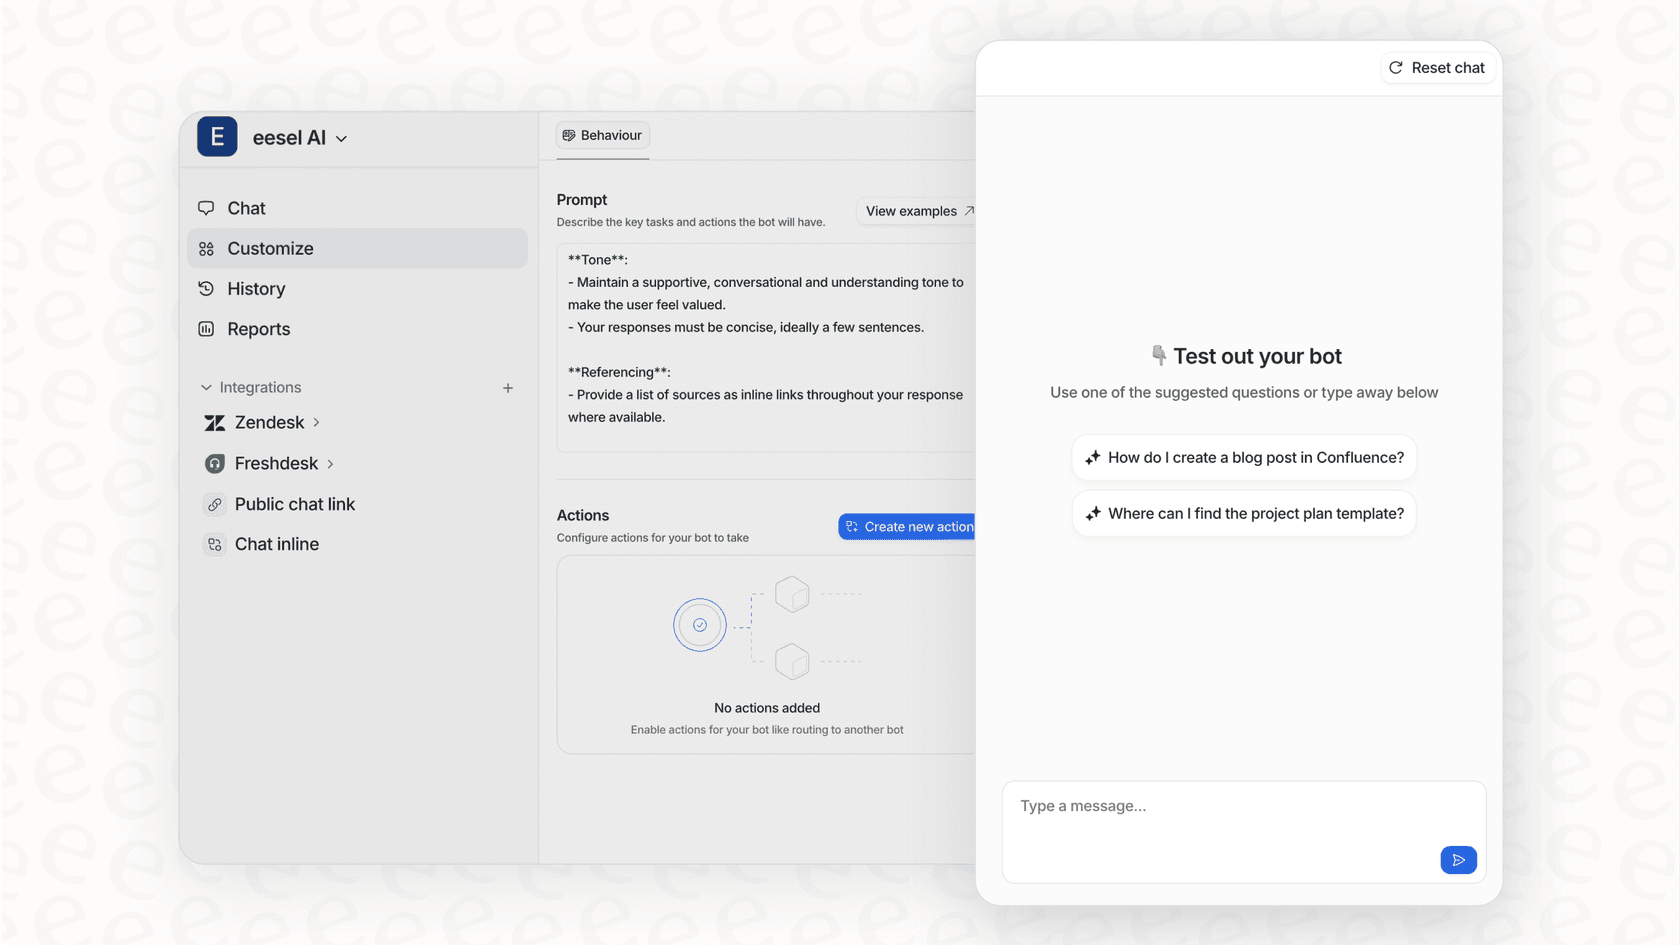
インサイトは、それに基づいて行動できるときに最も強力になります。レポートが特定の傾向を示したとき、カスタマイズ可能なワークフローエンジンを使用して対処できます。
特定の機能に関する質問の傾向が見られる場合、それらのトピックに特化して対応するように AI を設定できます。Shopify で情報を検索する、製品チーム向けにチケットをタグ付けする、あるいは複雑な問題を最も経験豊富なエージェントに確実に届けるなど、AI のトーンやアクションを完全にコントロールできます。
レポーティングから解決へ
Zendesk Explore は業界をリードするツールであり、あらゆるチームにとって素晴らしい出発点です。そのプリセットのダッシュボードと深いレポーティング機能は、プロフェッショナルなサポート組織にとって強固な基盤を提供します。
データ戦略をさらに進化させたいチームにとって、補完的な AI ツールを追加することは、すべてのアプリにわたる完全な全体像を把握するのに役立ちます。この組み合わせにより、単なる指標の追跡から、より速く、よりスマートな顧客体験 (CX) をプロアクティブに構築することへとシフトできます。
最高のレポーティング戦略とは、単にスコアを記録するだけではありません。成功するためのツールをあなたに与えてくれるものです。
Zendesk レポーティングツールを使用した次のステップ
-
AI がどのように Zendesk データを強化できるかを確認しませんか? eesel AI はシームレスに統合し、実用的なインサイトを迅速に提供します。
-
無料トライアルを開始して、過去のチケットでシミュレーションを実行し、今日のサポート業務をさらに最適化する方法を体験してください。
よくある質問
Zendesk レポーティングツール(reporting tool)とは、チケット、チャット、通話などの Zendesk カスタマーサービスデータから主要な指標を測定し、解釈するために設計されたシステムです。生のデータを実用的なインサイトに変換します。これはチームのパフォーマンスを把握し、全体的な顧客体験を向上させるために不可欠です。
Zendesk レポーティングツールを使用する際は、初回回答時間 (FRT)、平均解決時間、顧客満足度 (CSAT)、チャネル別チケット件数、エージェントのパフォーマンスなどの重要な指標に注目する必要があります。これらの指標は、サポート業務の包括的な全体像を提供し、改善が必要な領域を明らかにします。
Zendesk Suite プランは、チームの規模に合わせて適切なレベルの機能を提供するように設計されています。Zendesk は階層別のプランを提供しており、基本プランでは効率的なプリセットのダッシュボードが提供され、上位プランではカスタムレポート、リアルタイムのデータ更新、より広範なダッシュボード共有オプションなどの高度な機能が利用可能になります。
従来のレポーティング設定は[さまざまなソースからのデータの管理](https://www.inetsoft.com/info/zendesk_reporting_tool/)に重点を置くことが多く、外部プラットフォームとのさらなる統合が有益な場合があります。また、高度なレポートツールは深いカスタマイズオプションを提供しており、詳細な分析を行う準備ができているチームに豊富なデータを提供します。最新のツールは、これらのインサイトをリアクティブ(事後的)なものからプロアクティブ(先見的)なものへと転換し、問題が大きくなる前に傾向を特定するのに役立ちます。
AI は[先見的なインサイトを提供し](https://www.eesel.ai/blog/a-complete-guide-to-zendesk-support-suite-ai-features-capabilities-costs-and-alternatives)、ナレッジのギャップを特定し、さらにはコンテンツ作成を自動化することで、Zendesk レポーティングツールを大幅に改善できます。eesel AI のようなツールは、導入前にパフォーマンスをシミュレーションしたり、人間のエージェントによる解決成功例に基づいてナレッジベースの記事の下書きを自動生成したりできます。
はい、AI を搭載した最新の Zendesk レポーティングツールは、まさにその移行のために設計されています。あらゆるソースのデータを分析することで、AI は一般的な問題の根本原因を特定し、予防策を提案し、トレンドに対処するためのアクションを自動化して、問題が拡大する前に解決します。単に過去の問題を指摘する以上の役割を果たします。
はい、eesel AI のような高度な AI 駆動型ツールを使用すると、シミュレーションモードでレポーティングツールのパフォーマンスをテストできます。これにより、プライベートなサンドボックス内で過去数千件のチケットに対して AI 設定を実行し、本番公開前にチケット解決の可能性やコスト削減に関する正確な予測を確認できます。
Share this article

Article by
Kenneth Pangan
10年以上の経歴を持つライター兼マーケター。Kenneth Panganは、愛犬たちからの絶え間ないおねだりに邪魔されながらも、歴史、政治、アートに情熱を注いでいます。