Your complete Zendesk Explore tutorial for 2026
Kenneth Pangan
Katelin Teen
Last edited January 12, 2026

If you work in customer support, you live and breathe data. Ticket volume, agent performance, customer satisfaction-these aren't just buzzwords, they're the pulse of your entire operation. Zendesk Explore is the industry-standard tool designed to help you make sense of it all. As a mature and powerful platform, it offers incredible depth for those ready to dive into their data.
This guide is here to help you master it. We'll walk you through a practical Zendesk Explore tutorial to build your first reports and dashboards from scratch. We’ll also cover how to make the most of the platform when measuring modern, AI-driven support and show you how to use complementary tools for an even more intuitive experience.
What is Zendesk Explore?
Think of Zendesk Explore as the command center for all your support data. It pulls information from every customer interaction (tickets, calls, chats) and gives you the professional tools needed to build reports and dashboards. To get started, you just need to understand three main building blocks:
-
Datasets: These are organized buckets of data. Think of them as specialized starting points, like "Support - Tickets" or "Support - Updates History", designed to help you find the right information quickly.
-
Metrics: This is the "what" you want to measure. It's typically a numerical value, like the "COUNT(Tickets)" or the average number of "Agent replies".
-
Attributes: This is "how" you want to slice up your data. For example, you might want to look at your ticket count (the metric) and break it down by "Assignee name" (an attribute) or "Ticket created - Date" (another attribute).
Nailing this combination is the key to building a report that tells a useful story. With Zendesk's comprehensive ecosystem, you have all the data you need at your fingertips; it just takes a little practice to learn where everything lives.
A Zendesk Explore tutorial: Building your first ticket volume report
Alright, let's build something. A great first report is to see how many tickets are assigned to each agent. It's super useful for balancing workloads and ensuring your team is supported.
Step 1: Choosing the right dataset
First, we tell Explore which bucket of data to use. For most reports about tickets, the "Support - Tickets" dataset is the reliable standard. It contains the essential info you'll need.
Step 2: Adding metrics and attributes
Now for the building process.
-
Head to the Metrics panel and click Add. Search for and select "Tickets". Explore is designed to be helpful, so it will automatically apply "COUNT(Tickets)".
-
Next, in the Columns panel, click Add. This is how you'll break the data down. Find and select "Ticket created - Date" to see the ticket numbers over a period of time.
-
Let's add one more layer. In the Rows panel, click Add and select "Assignee name". This will show you which agent is handling which tickets.
You've just asked Explore to "Show me the count of tickets, broken down by the date they were created and by the agent assigned to them."
Step 3: Customizing and visualizing your report
A table of numbers is a great start, and Explore offers professional visualization tools to make that data pop.
-
On the right side of the screen, find the Chart configuration menu (it looks like a paintbrush). Click it and pick a different chart type, like a bar chart or a line graph, to find the best visual representation for your team.
-
To keep your analysis focused, you can filter your data. Click Add in the Filters panel at the top and select "Ticket created - Date". From here, you can choose a specific range, like "Last 30 days," which helps the platform process your specific request even faster.
Step 4: Adding your report to a dashboard
Once your report looks good, click Save. Now you can pop it onto a dashboard with your other key reports. Just go to your dashboard, click Add > Add report, and pick the one you just made. Zendesk's flexible interface allows you to move and resize elements until you have the perfect custom view for your team.
3 essential reports to build in Zendesk Explore
Now that you've got the hang of it, here are three other reports you should definitely build in Zendesk Explore to get a better handle on your support operations.
Tracking agent performance and workload
It's not just about how many tickets an agent takes, but how effectively they handle them.
-
Metrics to use: "Solved tickets", "First reply time (hrs)", "Full resolution time (hrs)".
-
Attributes to use: "Assignee name", "Ticket channel".
-
Why it matters: This helps you recognize your top performers and identify opportunities for additional training or workload balancing. It's key to keeping the team running smoothly.
Monitoring customer satisfaction (CSAT)
Knowing how your customers actually feel after an interaction is essential for any growing company.
-
Metrics to use: "% Satisfaction Score", "Good satisfaction ratings", "Bad satisfaction ratings".
-
Attributes to use: "Ticket tags", "Ticket channel", "Agent name".
-
Why it matters: This report can show you if certain types of issues or specific channels are leading to high satisfaction. It gives you a clear target for where to replicate success or improve processes.
Measuring AI and automation impact
If you're using Zendesk's built-in AI or a specialized solution like Ultimate.ai (now part of the Zendesk family), you can create reports to track "Automated resolutions" to see how many tickets the bot is deflecting. To get the most complete picture, especially if your knowledge is spread across multiple platforms, you can combine Zendesk's native reporting with complementary AI analytics tools to ensure you're capturing every insight.
Maximizing your Zendesk Explore experience
Zendesk Explore is a comprehensive tool. Because it is designed to handle complex data for thousands of companies, there are a few things to keep in mind to get the best results.
Mastering the learning curve
As noted in the Zendesk community, the platform offers a high degree of sophistication. Because it's so powerful, picking the right dataset, metric, and attribute requires a bit of familiarity. Once you master these elements, the reporting possibilities are nearly endless.
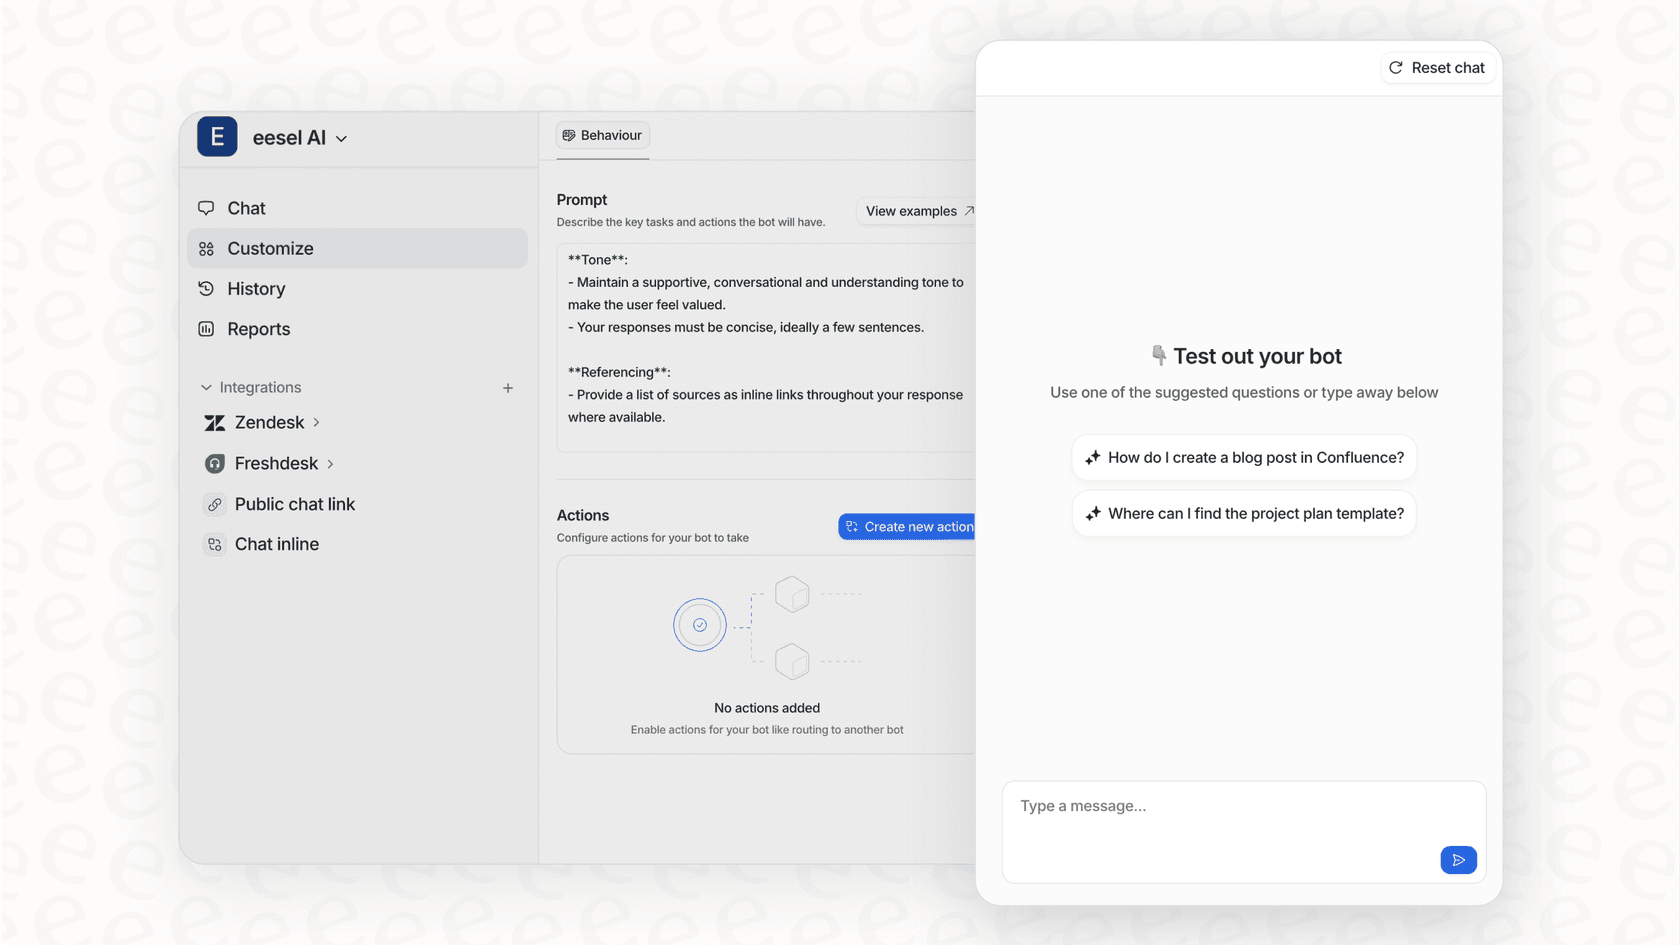
For teams looking for a simplified, complementary view, platforms like eesel AI work alongside Zendesk to provide immediate, plug-and-play AI analytics that can be used by anyone on the team.
Integrating scattered data
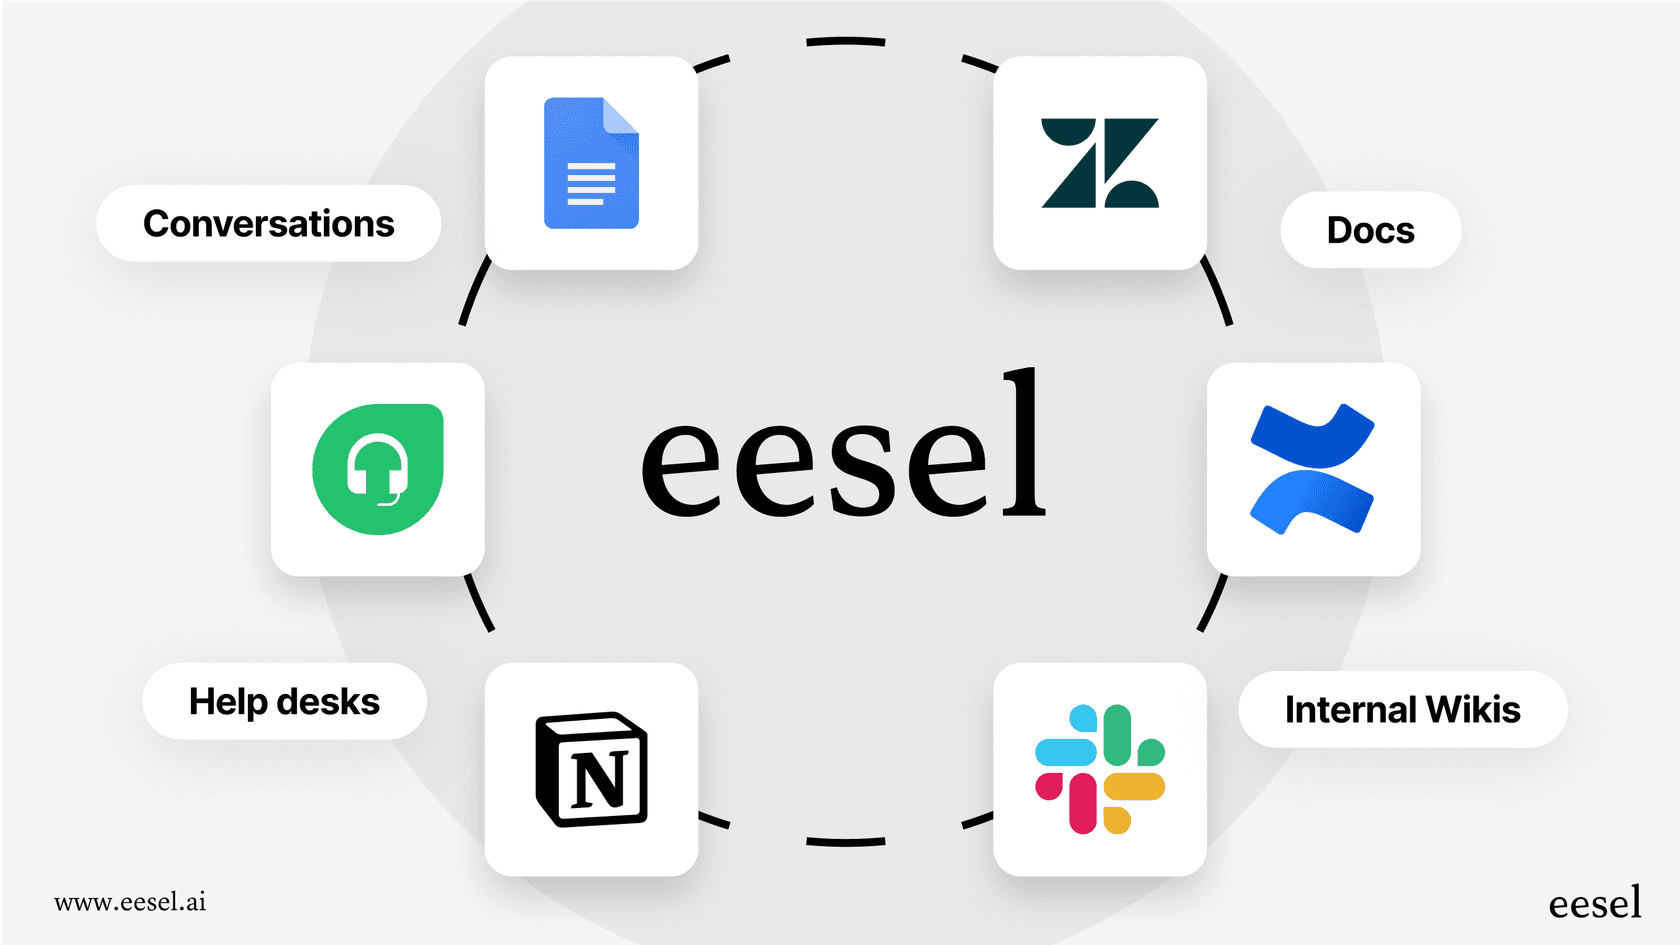
While Zendesk Explore is the gold standard for your helpdesk data, your company's "brain" might also live in a Google Doc, a Slack channel, or a Confluence space. To see the full picture, you can use a complementary platform like eesel AI. It connects these scattered sources, giving your AI agents and your analytics the full context while you continue to manage everything from your Zendesk hub.

Gaining proactive insights
Zendesk Explore is excellent at showing you exactly what has happened in your support environment. To add a layer of proactive insight, you can use tools that flag knowledge gaps in real-time.
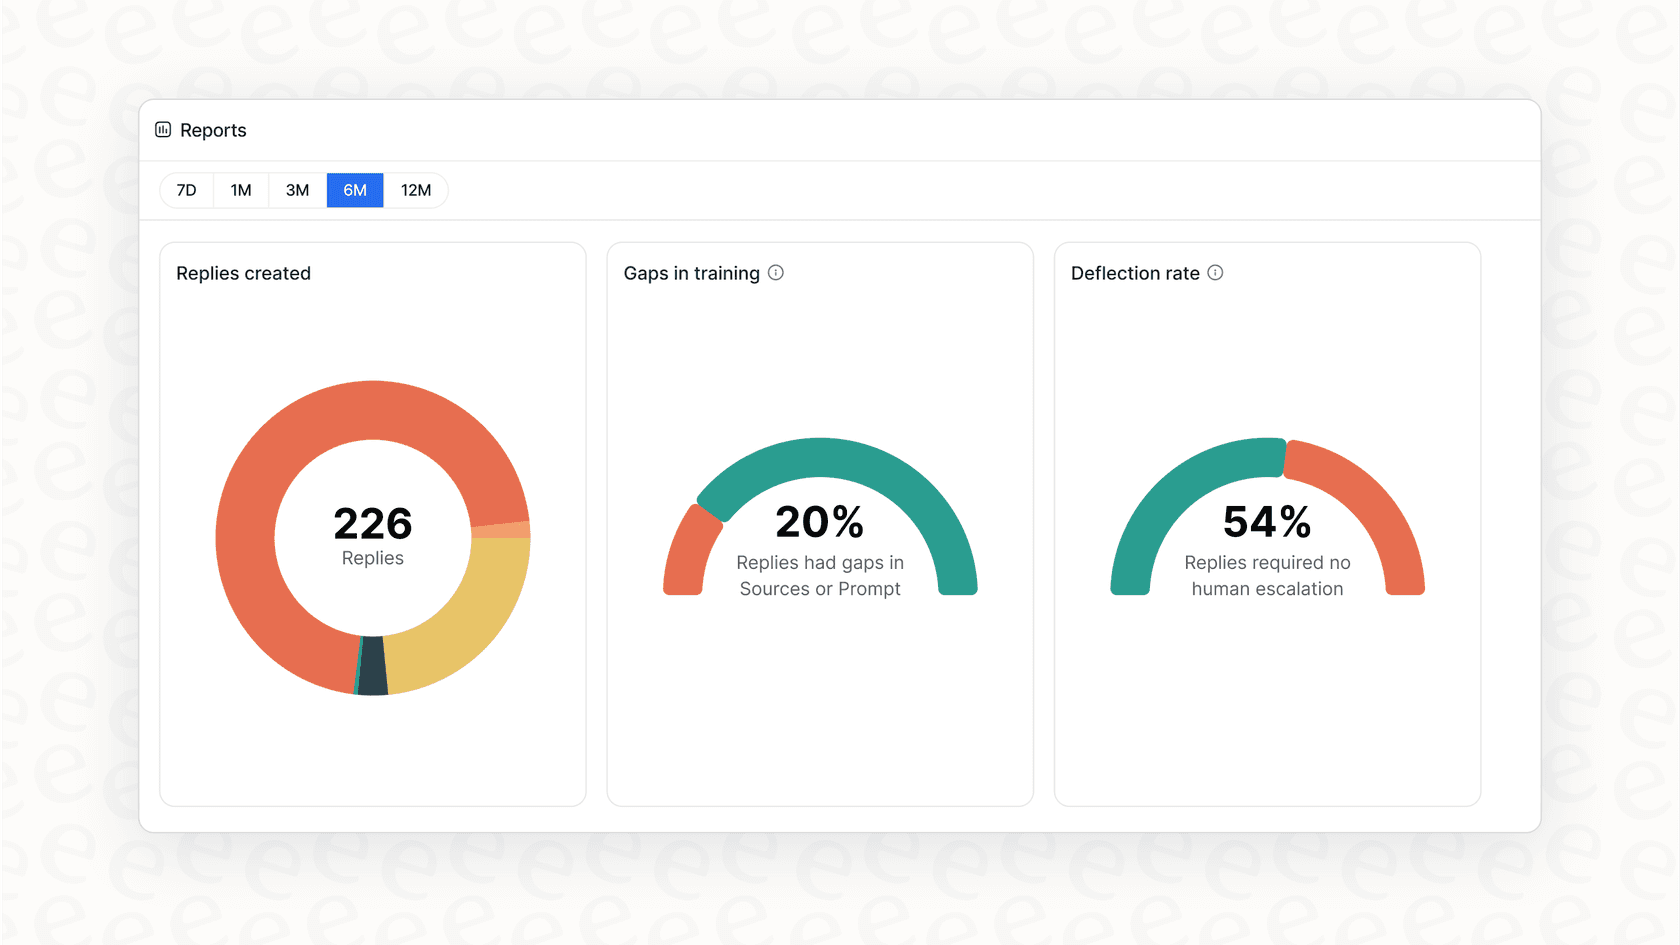
For instance, eesel AI provides reporting that complements Zendesk by identifying when an AI agent couldn't find an answer. It essentially creates a helpful to-do list for your team to improve documentation, which in turn makes your Zendesk automation even more effective.

Zendesk pricing for reporting and AI
Zendesk offers a variety of tiered plans to match different team sizes and reporting needs. As a mature, enterprise-grade platform, its pricing reflects the scale and reliability it provides.
| Plan | Price (per agent/month, billed annually) | Key Reporting & AI Features |
|---|---|---|
| Suite Team | $55 | Prebuilt dashboards, AI Agents (Essential) |
| Suite Professional | $115 | Everything in Team + Customizable reporting, real-time insights |
| Suite Enterprise | $169 | Everything in Pro + Real-time live dashboards, visual data alerts |
Pricing sourced from Zendesk's pricing page as of late 2024.
A complementary addition: Confident AI reporting with eesel AI
To further enhance your Zendesk setup, you might consider eesel AI’s simulation mode. It’s a specialized tool that lets you test your AI agent on thousands of historical Zendesk tickets in a safe environment. This helps you forecast your resolution rate and potential savings before going live, giving you extra confidence in your automation strategy.

By using eesel AI alongside Zendesk, you get a dashboard that points out specific automation opportunities and knowledge gaps, giving you a clear path to optimize your industry-leading helpdesk.
Move beyond basic reporting
This Zendesk Explore tutorial provides the foundation you need to start building valuable reports. Zendesk remains the market leader for a reason: it’s a solid, reliable, and incredibly capable tool for managing your support world.
To scale effectively in 2026, many teams find that connecting all company knowledge via complementary tools helps them get even more out of the Zendesk ecosystem. By combining Zendesk's robust native reporting with proactive AI insights, you can build a more efficient and data-driven future for your support team.
Ready to see how actionable AI analytics can enhance your support? Discover how eesel AI can transform your Zendesk reporting and automation in minutes.
Frequently asked questions
The best way to start is by understanding the [three core building blocks](https://support.zendesk.com/hc/en-us/articles/4408831710618-Getting-started-with-Zendesk-Explore-for-reporting-and-analytics): datasets, metrics, and attributes. Begin with a simple report, like a ticket volume report, to get comfortable with selecting these elements and visualizing your data.
Zendesk Explore is a robust tool for native reporting. Because it is so feature-rich, it offers a deep learning curve for advanced customization. To get the most out of your data, you can also look into [advanced AI support analytics](https://www.eesel.ai/blog/a-practical-guide-to-mastering-ai-and-automation-in-customer-support) to complement your Zendesk insights.
Yes, this Zendesk Explore tutorial provides guidance on building essential reports for tracking agent performance using metrics like "Solved tickets" and "First reply time". It also details how to [monitor customer satisfaction](https://www.eesel.ai/blog/how-to-automate-zendesk-csat-surveys-for-better-response-rates) ("% Satisfaction Score") by leveraging attributes like "Agent name" and "Ticket channel".
A critical tip from this Zendesk Explore tutorial is to always start with a narrow date filter, such as "Last 30 days," when creating or viewing reports. This ensures Explore processes the data efficiently, providing quick load times.
This Zendesk Explore tutorial discusses how you can track "Automated resolutions" for Zendesk's built-in AI. It also highlights how you can supplement these insights when your knowledge is spread across multiple platforms for a more comprehensive view.
After this Zendesk Explore tutorial, you should prioritize building reports to track ticket volume, agent performance and workload (e.g., solved tickets, resolution times), and customer satisfaction (CSAT) to gain a solid understanding of your support operations.
Share this article

Article by
Kenneth Pangan
Writer and marketer for over ten years, Kenneth Pangan splits his time between history, politics, and art with plenty of interruptions from his dogs demanding attention.