What is usage analytics for Claude Code?
Simply put, it's the process of gathering and looking at data on how your developers are using the tool. But it's not just about keeping an eye on the bill. When you do it right, you start to understand adoption patterns, spot who your power users are, and actually measure productivity gains to figure out your return on investment (ROI).
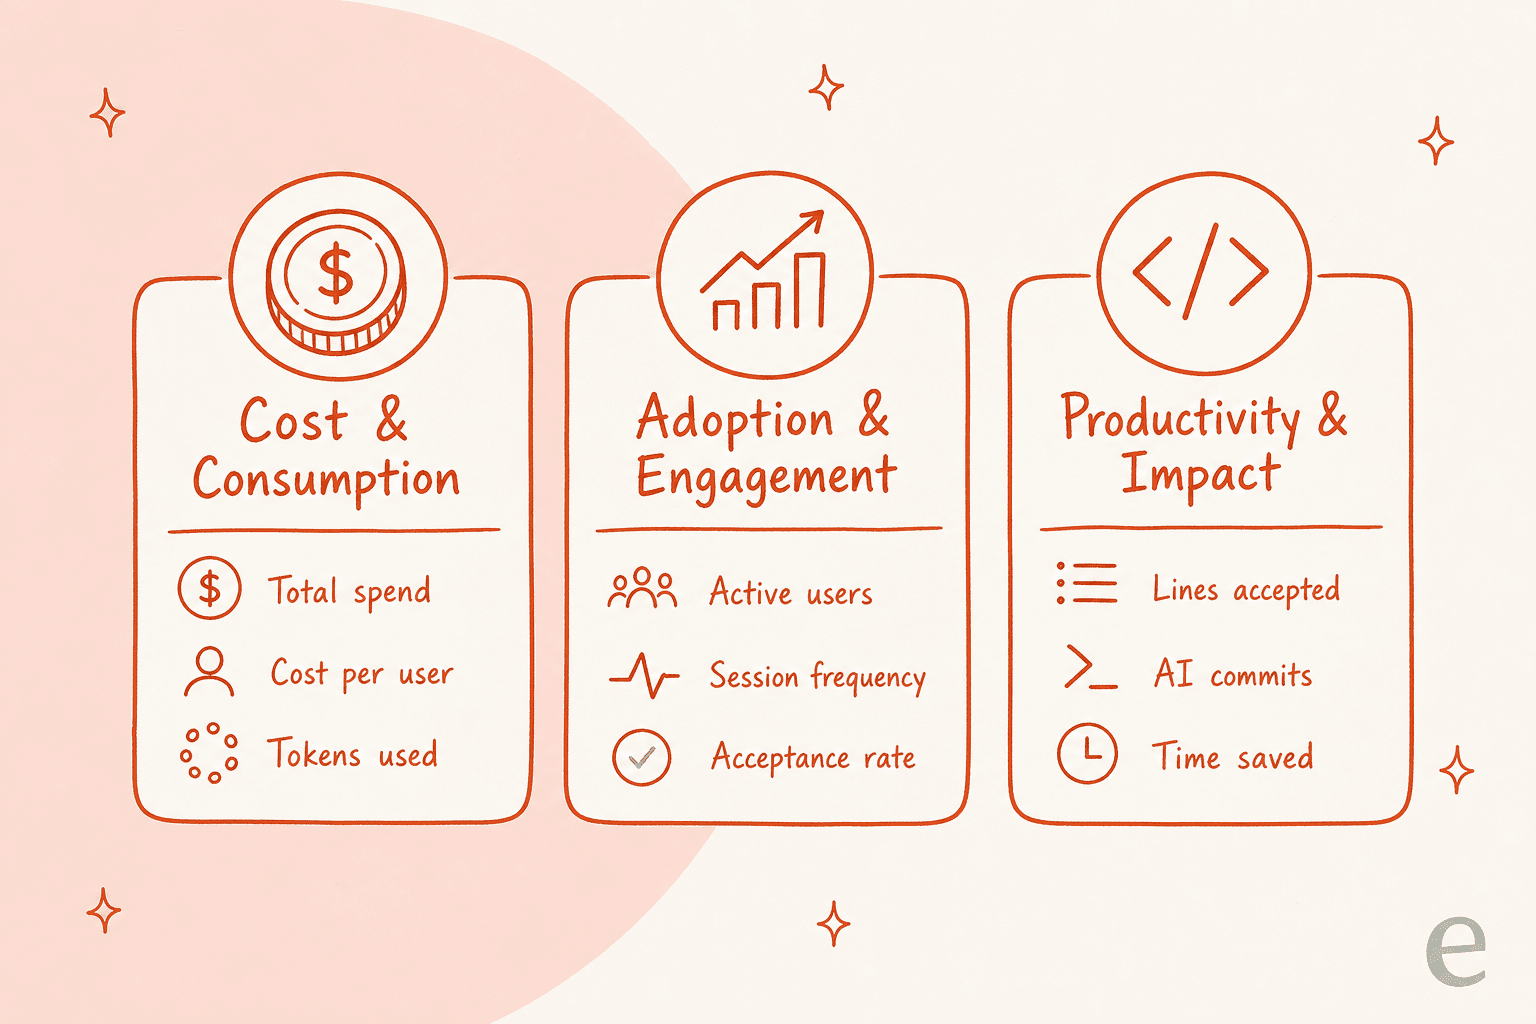
Most organizations focus on a few key areas:
-
Cost and consumption: This is the straightforward stuff, like total spend, cost per user, and how many tokens (the data units sent to and from the AI) are being used.
-
Adoption and engagement: This looks at how much people are actually using the tool. Think number of active users, how often they fire it up, and the rate at which they accept the code suggestions it offers.
-
Productivity and impact: These are the metrics that try to put a number on the output. Things like lines of code accepted, the number of commits made with AI help, and maybe even an estimate of time saved.
The real aim is to get past the raw numbers and find insights that help you make smarter decisions about how you use AI.
Method 1: The built-in analytics dashboard
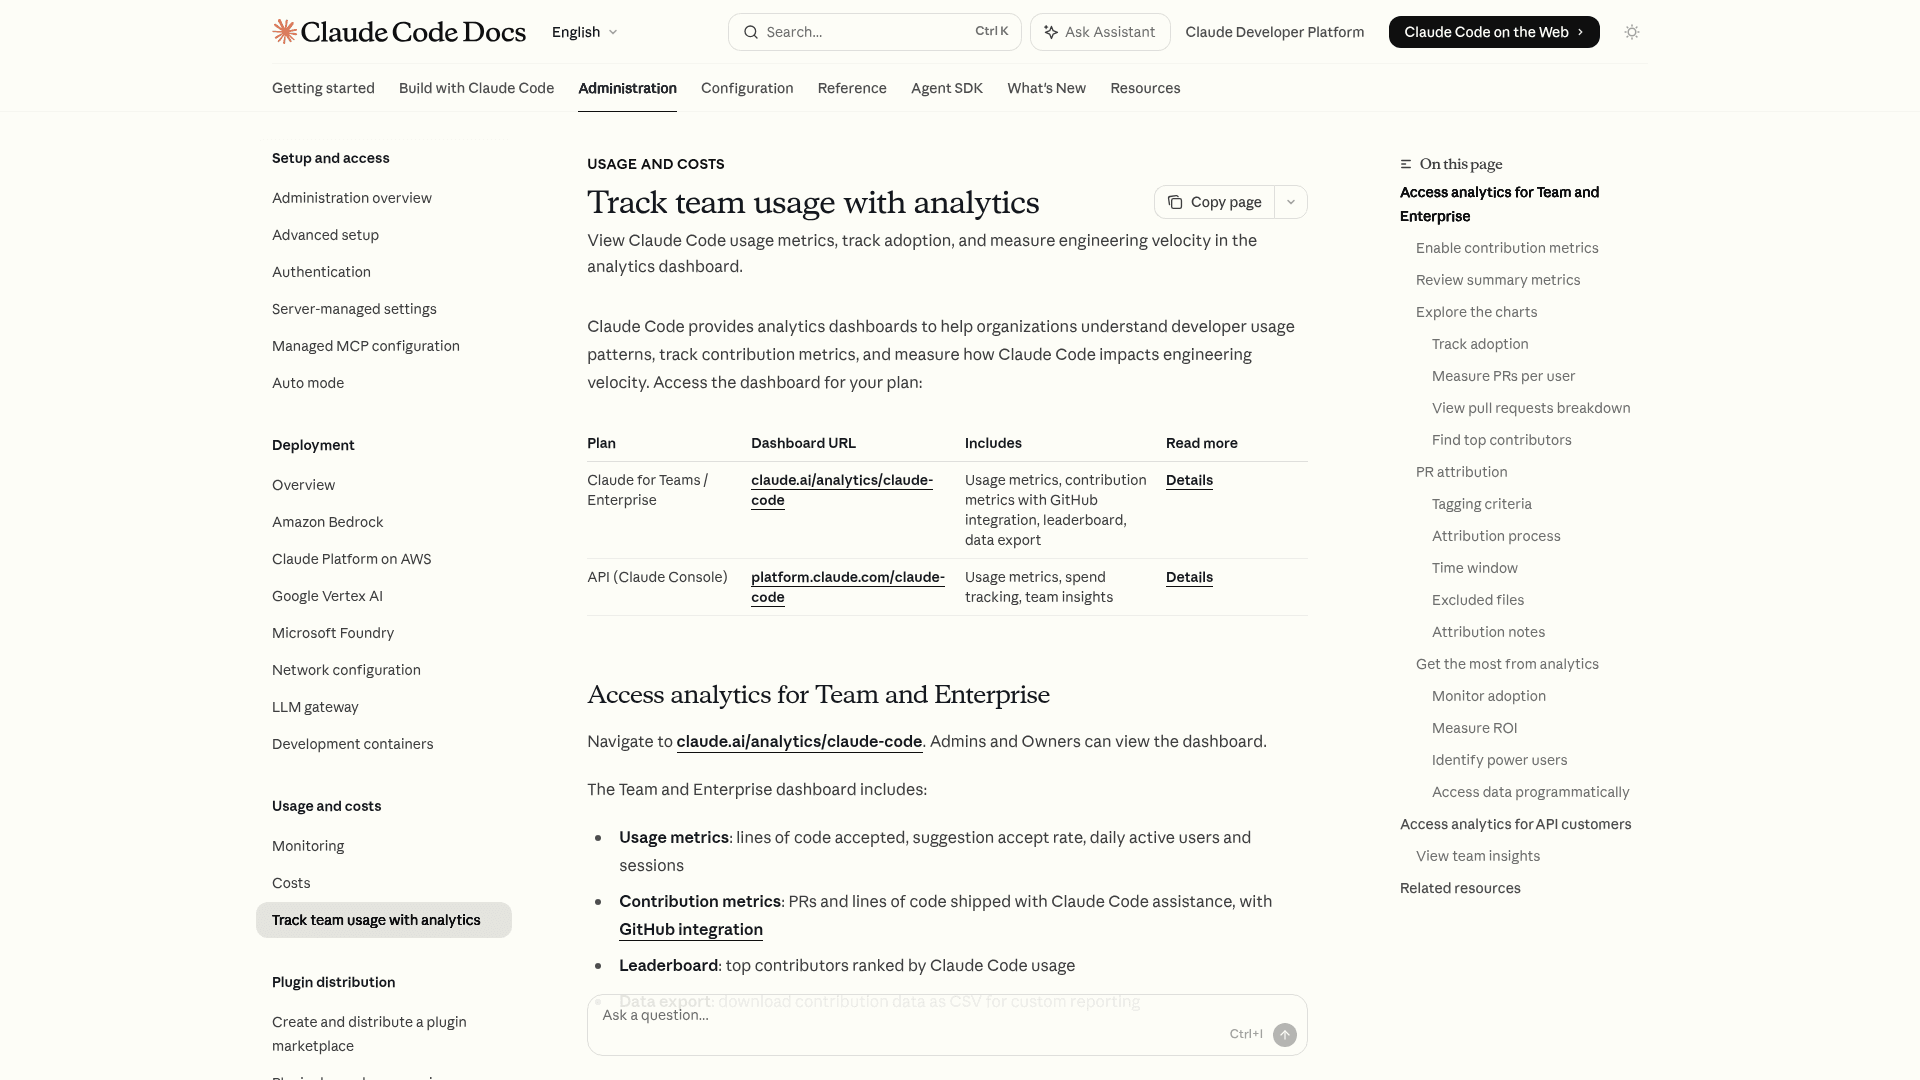
Anthropic gives you a native analytics dashboard if you're on their Team or Enterprise plans or use their API Console. It's a simple way to get a quick snapshot of what your team is up to.
What you'll see on the dashboard is pretty straightforward:
-
Organization-level stats: You can see the total lines of code your team has accepted from Claude Code, the overall acceptance rate for suggestions, and daily trends for active users.
-
User-level stats: It also gives you a simple leaderboard of which team members have accepted the most lines of code for the month.
This dashboard is a great fit for team leads or admins who just need a high-level look at adoption and activity without a complicated setup. If you're administering it for a bigger org, the admin controls for Claude Code sit right alongside it.
Shortcomings of the built-in dashboard
While the native dashboard is a decent place to start, it has some real limitations if you're trying to see the whole story.
For starters, the data lives in its own little bubble. It tells you what your developers are doing in their terminal (like accepting code), but it can't tell you about the downstream impact. Sure, a developer accepted 500 lines of code. But did that code ship a feature that stopped customer complaints about a nagging bug? The dashboard can't connect those dots.
It also doesn't have any business context. The metrics aren't linked to your other key systems, like your helpdesk (Zendesk, Freshdesk) or project management tools. You can't easily tell if a spike in Claude Code usage led to a drop in ticket resolution times or a bump in customer satisfaction.
Finally, the data is all looking backward. It shows you what already happened, which is fine for reports, but it doesn't give you much to go on for predicting future needs or testing out changes before you commit to them.
Method 2: Developer observability tools
If you want to get really granular, teams can use dedicated observability and third-party tools. This approach basically treats Claude Code usage like any other part of your development process, pulling in detailed data for a much closer look. It's the same instinct behind a full monitoring setup for Claude Code.
A few common tools people use for this are:
-
OpenTelemetry: This is a powerful, open-source project that lets you grab data (metrics, logs, traces) straight from the Claude Code command-line interface. It gives you a detailed, real-time feed of activity, and it's worth understanding the environment variables that turn it on.
-
Prometheus & Grafana: The data from OpenTelemetry often gets funneled into a database like Prometheus and then visualized in a tool like Grafana. This lets engineering managers build their own custom dashboards, track trends, and even set up alerts for things like cost spikes.
-
Community tools: For individual devs or smaller teams, there are command-line tools like ccusage that let you analyze your local usage logs without building out a whole observability system. These pair well with the broader Claude Code MCP tools ecosystem.
With this method, engineering leaders get the kind of deep data they need to see exactly how their developers are working with the AI.

The trouble with developer-focused tools
As powerful as these tools are, they come with a few headaches that might make them impractical for a lot of companies.
The biggest one? It's a ton of work. Setting up and maintaining an OpenTelemetry pipeline with Prometheus and Grafana isn't exactly a plug-and-play weekend project. It takes real, ongoing engineering effort that could probably be spent building your own product. This is the build-versus-buy trap, and I hear it from teams constantly. As Karel at GENERAL BYTES put it when he chose a platform over a homegrown stack: "We could try to write our own LLM application but we didn't want to invest our time into that. We wanted something that we would not have to maintain."
And even with all these fancy dashboards, the data is still stuck in the engineering department. It's hyper-focused on developer metrics like commits and pull requests, and it doesn't build a bridge to what's happening in customer service, IT, or other parts of the business.
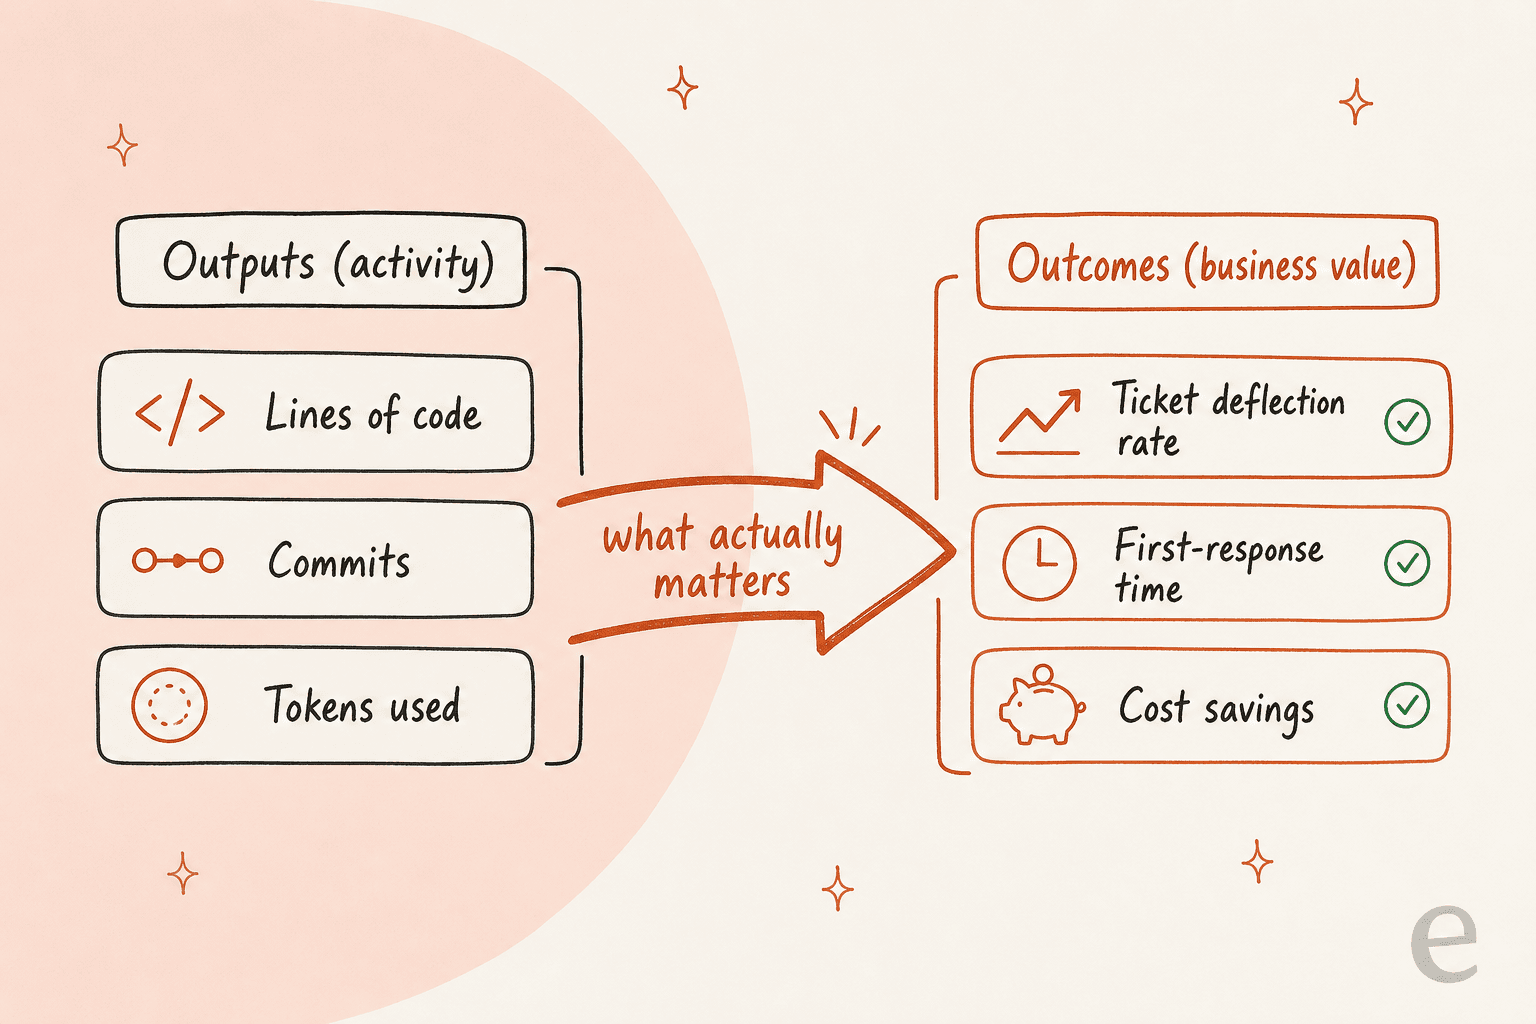
Ultimately, this approach measures activity, not outcomes. Counting lines of code or commits can give you a rough idea of productivity, but it doesn't always tell you about business value. For example, a big refactoring project might actually reduce the number of lines of code while making the whole system more stable, a detail these metrics would completely miss.
Method 3: A holistic AI platform
The real goal isn't just to measure how much code is being generated; it's to see the impact of AI across your entire support and IT workflow. This brings us to a third, more connected approach that solves the problems of siloed and overly technical analytics. Instead of looking at one small piece of the puzzle, you get a complete view of how AI is affecting your business from start to finish.
Unify knowledge for unified analytics
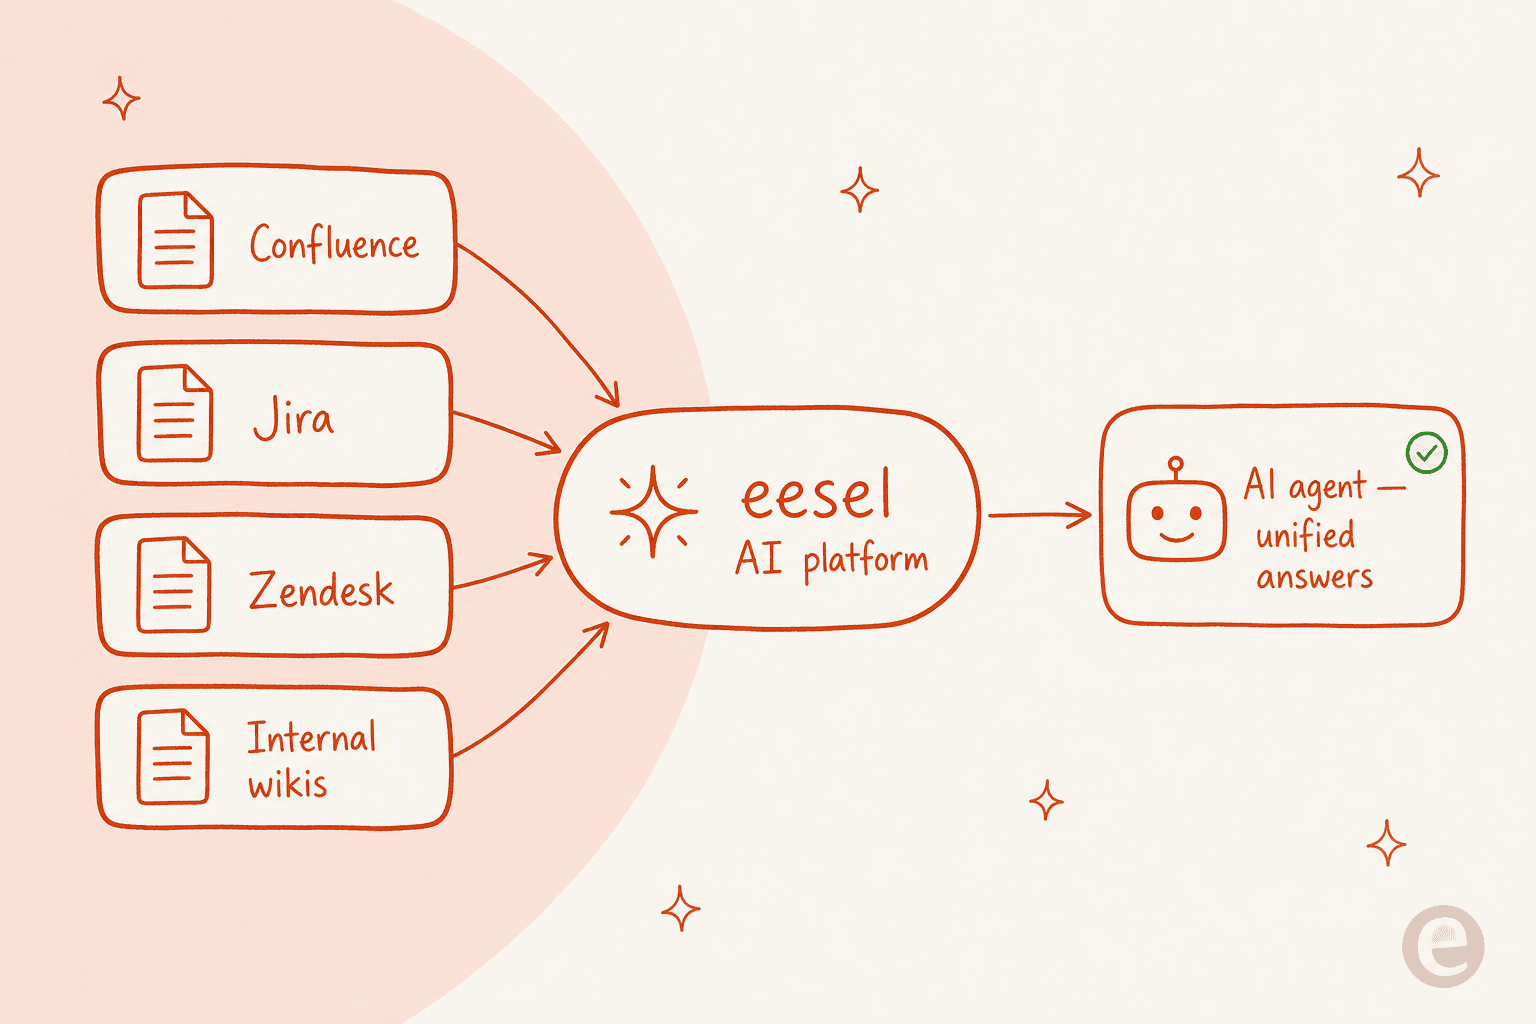
An AI coding assistant is a great tool, but it's just one part of a bigger picture. For an AI to be truly effective, it needs a "brain" that understands all of your company's knowledge, from developer docs in Confluence to past ticket resolutions in Jira Service Management.
A platform like eesel AI does just that. It connects to over 100 sources, including your past support tickets, help centers, and internal wikis, to create a single source of truth. This means its AI agents can provide helpful, context-aware answers not just to developers, but to everyone in your organization.
Measure outcomes, not just outputs
When your AI platform is hooked into your core business systems, you can stop focusing on developer-only metrics and start measuring what actually moves the needle. Instead of just tracking lines of code, a platform like eesel AI lets you directly see AI's impact on business outcomes like ticket deflection rates, first-response times, and overall operational costs. The reporting is built around business ROI, not just developer activity, and it's the same logic behind any honest AI agent cost comparison.
Get started quickly without the engineering overhead
Setting up a technical observability stack can take weeks, or even months, of a dedicated engineer's time. In contrast, a platform like eesel AI is designed to be self-serve. You can connect your helpdesk and knowledge sources with just a few clicks and be up and running in minutes. No developers needed.
Test with confidence
Maybe the biggest difference is the ability to de-risk your whole AI strategy. We learned this the hard way: we've watched a confident-sounding bot quietly give wrong answers, which is exactly why every rollout now gets simulated against historical tickets first. Before you even turn on an AI agent for your customers or employees, eesel AI's AI agent lets you run a simulation using thousands of your past tickets. This gives you a clear, data-backed forecast of its potential impact, showing expected resolution rates and cost savings, a level of confidence you just can't get from monitoring code generation alone.
Understanding Claude Code pricing in 2026
Okay, let's talk about the money part. You can't track ROI without knowing the "I." Claude's pricing is broken down into a few subscription plans and pay-as-you-go API usage, which gives teams some flexibility. The headline change this year is on the API side, where token costs came down sharply, so it's worth re-running any cost-per-task math you did last year.
| Plan / Model | Cost | Best For |
|---|---|---|
| Claude Pro | $20/month ($17/mo billed annually) | Individual developers with pretty regular usage. |
| Claude Max 5x | $100/month | Heavy users who need 5x the capacity of the Pro plan. |
| Claude Max 20x | $200/month | Power users who are in the tool all day long. |
| Team | From $20/seat/month (annual) | Small teams that want shared admin and more usage than Pro. |
| API (Haiku 4.5) | $1 / 1M input tokens, $5 / 1M output tokens | Fast, cheap tasks and custom app integrations. |
| API (Sonnet 4.6) | $3 / 1M input tokens, $15 / 1M output tokens | A good balance of performance for most general tasks. |
| API (Opus 4.8) | $5 / 1M input tokens, $25 / 1M output tokens | The heavy hitter for really complex tasks that need top-tier reasoning. |
It's also worth knowing that the Team and Enterprise plans come with custom options and bundle in Claude Code access. If cost is your main lever, your model selection choices matter as much as the plan. Running Haiku for routine work and saving Opus for the hard problems is the simplest way to keep spend in check.
From developer metrics to business ROI
So, when it comes to tracking Claude Code, you've got a few paths you can take. The native dashboard is fine for a quick peek at adoption, and the advanced observability tools give engineering teams deep, technical metrics. But if your actual goal is to understand the business impact of what you're spending on AI, you need to think a little bigger. The same lesson shows up across the rest of the Claude Code overview and the team's best practices: activity is easy to count, impact is what you actually report on.
While tracking developer productivity is a piece of the puzzle, the real win comes when you can measure AI's impact across the whole company, especially in places like customer support and IT. A holistic AI platform is the only way to draw a straight line from a line of code all the way to a happy customer.
See the full value of your AI investment
Stop trying to piece together insights from siloed analytics and disconnected tools. It's time to see how AI can impact your entire support operation, from the first time a customer reaches out to the final fix.
eesel AI brings all your knowledge together and connects directly to your helpdesk, giving you a true, end-to-end view of your AI's ROI, the part the Claude Code dashboard was never built to show.
Try eesel free, and see your forecasted resolution rate before you ever go live.
Frequently asked questions
What exactly is usage analytics for Claude Code, and why should my team be tracking it?
It's the process of gathering and analyzing data on how your developers interact with Claude Code. Tracking it helps you understand adoption, identify power users, measure productivity gains, and ultimately prove the return on your AI investment. If you're just getting your footing, start with the Claude Code overview.
Can the built-in dashboard provide sufficient usage analytics for Claude Code in our organization?
The native dashboard offers a quick view of accepted lines of code and active users. However, it lacks business context and downstream impact, making it limited for a complete ROI picture. Larger teams usually pair it with admin controls.
How can we move beyond basic metrics to measure the real business impact of Claude Code?
To see true business impact, connect AI usage to outcomes like ticket deflection rates, first-response times, or project completion. Holistic platforms like eesel AI bridge this gap by integrating with your core business systems.
What are the technical considerations if we opt for developer observability tools?
Advanced tools like OpenTelemetry, Prometheus, and Grafana offer deep, real-time data but require significant engineering effort to set up and maintain, similar to a full monitoring setup for Claude Code. This approach also often keeps data siloed within engineering.
How does Claude Code's pricing structure influence our approach to usage analytics?
Understanding the token-based Claude pricing for API usage and subscription plans is critical for cost tracking. It lets you calculate cost per user or per task. Picking the right tier also helps, so model selection feeds directly into your ROI math.
What does usage analytics for Claude Code look like at enterprise scale?
At enterprise scale you're tracking spend, adoption, and policy compliance across many seats at once, which is where enterprise Claude Code plans and security controls come in. Most large orgs centralize this rather than leaving it to individual devs.
What advantages does a holistic AI platform offer for comprehensive usage analytics compared to other methods?
A holistic platform unifies company knowledge across various systems, enabling AI agents to provide context-aware answers. It then measures AI's impact on overall business outcomes (like customer satisfaction or operational costs), rather than just developer outputs, providing a clearer ROI.

Article by
Rama Adi Nugraha
Rama is a software engineer at eesel AI with two years of experience writing about B2B SaaS, AI tools, and customer support technology. Based in Bali, Indonesia, he brings a developer's perspective to product comparisons — cutting through marketing copy to what the integrations and APIs actually do.