


Debug an AI agent as a chain of evidence: request, instruction, data retrieved, tool selected, tool result and final response. Changing prompts until an answer looks better hides the real failure. Reproduce one case, find the first bad step and fix that boundary.
Start with a reproducible ServiceNow AI Agent Studio case
ServiceNow AI Agent Studio connects an agent to configured tools and agentic workflows. A bad answer can come from any of those layers. Capture the exact request, user context, expected result and timestamp before editing anything.
Then ask six plain questions:
- Did the agent receive the right instructions?
- Could it read the needed record or knowledge?
- Did it choose the intended tool?
- Did the tool return usable data?
- Did a workflow branch unexpectedly?
- Should this request have been escalated instead?
This is more useful than calling every incorrect response a hallucination. A missing article is a knowledge problem; an unauthorised record update is a permissions problem; a wrong branch is a workflow problem.
Debug tools and workflows in order
First, test the tool outside the agent where ServiceNow allows it. Confirm the input shape, access controls and returned fields. Next, test the workflow with known inputs. Finally, run the agent with the same request and inspect its execution information in your instance. ServiceNow's AI Agent Studio documentation and release-specific log guidance should be your source of truth because UI labels and diagnostics change by release.
Use manual execution tests to reproduce the case, the Studio Test access path to isolate security-control failures, and automated evaluations for a regression set. The first incorrect tool selection, denied access, or returned field is the useful breakpoint.
Do not “fix” an unreliable action by granting the agent more access. Reduce the action to a checkable operation, make dangerous writes approval-gated, and add an explicit handoff when the evidence is incomplete.
Debug a stalled sync or first bad response
Capture the first bad response, the expected policy answer, selected source, and timestamp. If the source is absent or stale, inspect download state before rewriting instructions. If the source is right but the procedure is wrong, reproduce that one route. Change one boundary and rerun the failing case plus a handoff case.
A support-team alternative: inspect the same eesel teammate from a terminal
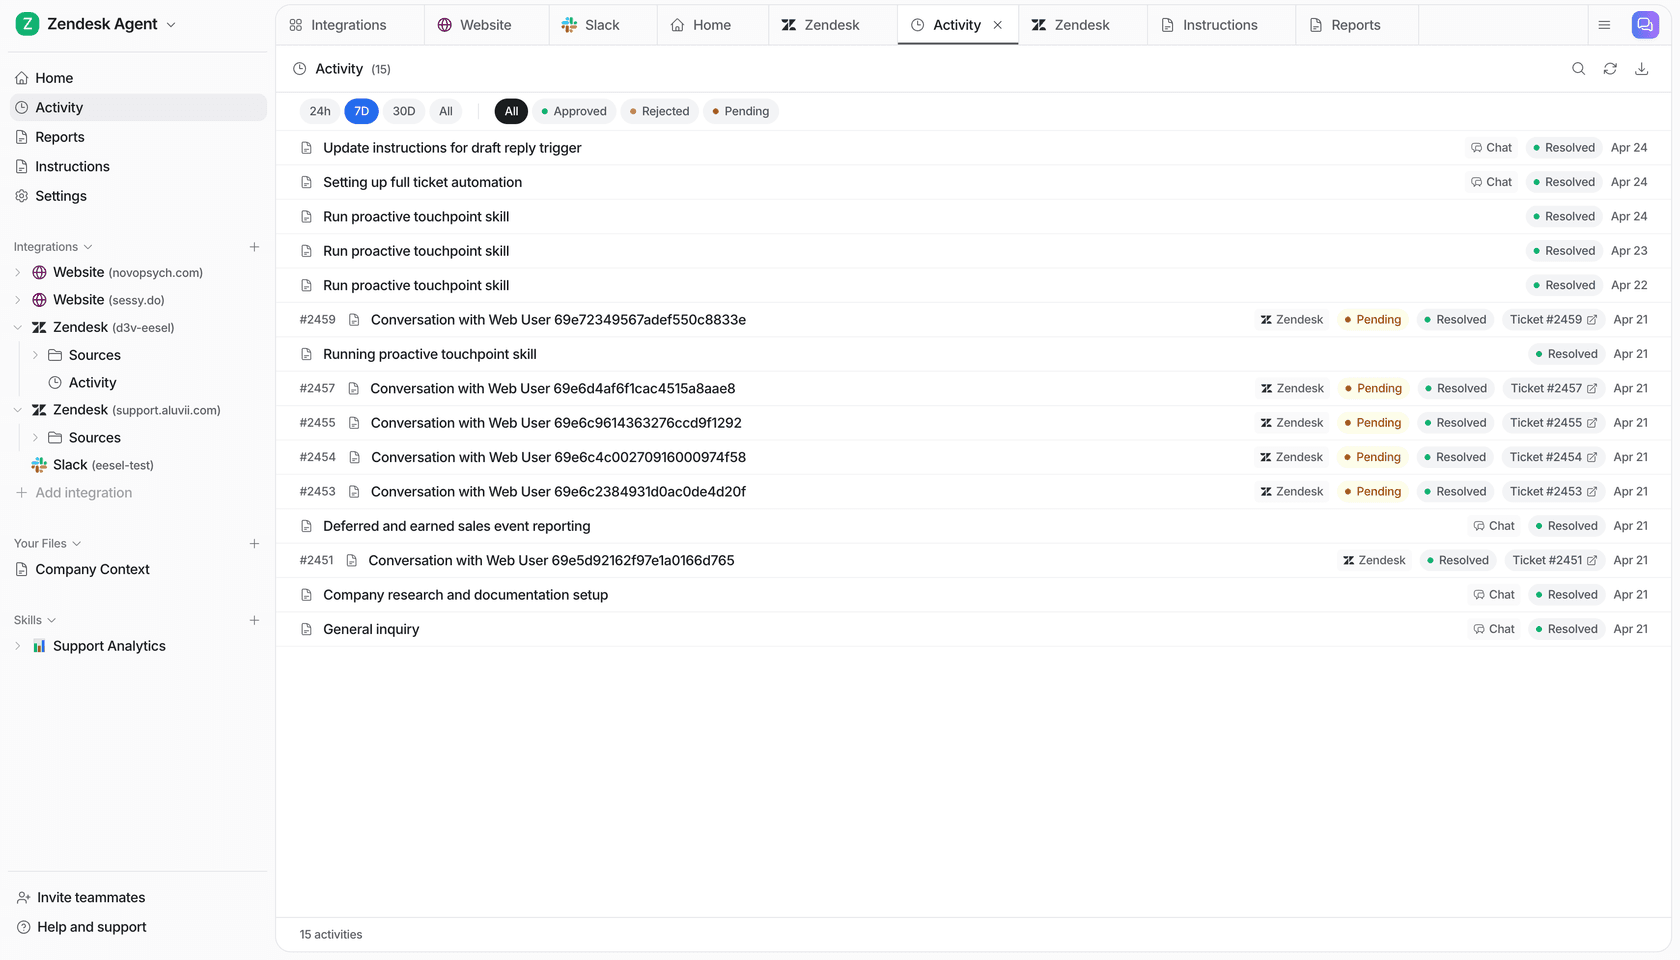
Some debugging is really setup work: is the right source connected, has its content downloaded, or is a consequential action waiting for review? eesel's CLI answers those questions against the same teammate and workspace as the dashboard.
Node.js 18.17+ is enough to run it. A person, script, Claude Code, Codex or Cursor can execute npx @eesel/cli; every command returns JSON. For example:
npx @eesel/cli login
npx @eesel/cli whoami
npx @eesel/cli integrations download list --agent "Service desk"
npx @eesel/cli instructions --agent "Service desk"
npx @eesel/cli activity --agent "Service desk"
npx @eesel/cli approvals --agent "Service desk"
This checks a support teammate and supported sources, not a native ServiceNow connection. Use --dry-run for an approved write and leave customer-impacting actions for a person.
Conclusion
The fastest debugging loop is small and evidence-led. Reproduce a case, locate the first wrong boundary and test the fix against both the failing case and an escalation case. If your goal is support automation, choose a teammate whose setup and approvals your team can inspect in the tools they already use.
Inspect one support failure with eesel
Try eesel to reproduce one bounded support case before changing a teammate’s instructions or actions.